
- Discovery MR750 3.0T System Service Methods
- 5690009-2EN Revision 4
- 00000018WIA30DD3E20GYZ
- id_131062998.0
- Feb 21, 2021 9:07:47 PM
Doing Multi-Nuclear Spectroscopy (MNS) functional checks
Prerequisites
| Personnel requirements | |||
|---|---|---|---|
| Required persons | Preliminary requirements | Procedure | Finalization |
| 1 | 15 minutes | 45 minutes | 30 minutes |
| Tools and test equipment | |||
|---|---|---|---|
| Item | Quantity | Part number | Manufacturer |
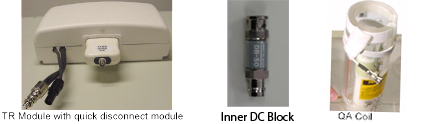
| 13C 3.0T | 1 |
2354050-6 - T/R Module 5114403-3 - QA Probe | - |
| 13P 3.0T | 1 |
2354050 - T/R Module 5114403-3 - QA Probe | - |
| 9-hole USS and Grafidy base plate | 1 | 46-271410 | - |
| Inner DC Block | 1 |
5309801 | - |
| Required conditions | |
|---|---|
| Condition | Reference |
| MNS option installed and amplifier calibrated. | - |
| Each time the QA coil is hooked up, the Inner DC block must be connected onto BNC connector of the QD box. | - |
Note: (For PET/MR systems) Remove the CMA coil and replace it with the CMA proxy. MNS will not operate with the CMA coil.
About this task
| Nucleus | Field Strength | Min Mag at TG = 0 | Min. SNR | Max NoiseStdev |
| 13C |
3.0T | 2.0 X 10^8 | 120 | 60000 |
| 31P | 3.0T | 2.0 X 10^8 | 280 | 60000 |
The following procedures are included in this functional test:
- See Functional test for the Functional Test.
- See Signal to noise test for the Signal to Noise Test.
- See Noise test for the Noise Test.
Functional test
Hardware Setup
Procedure
- Put the QA probe in the center hole on the grafidy base plate and lock the probe into place.
Figure 2. QA probe lock 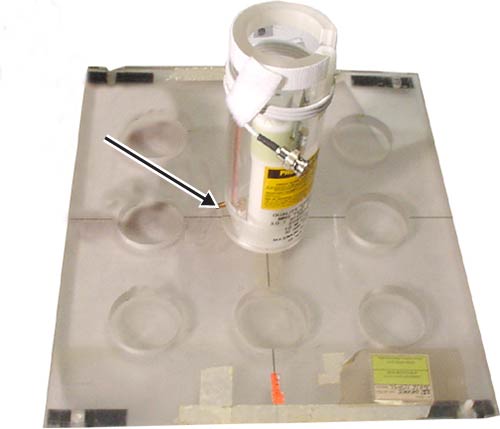
- Connect the Inner DC block between the QA probe cable and the quick disconnect module.
Figure 3. Inner DC block installed 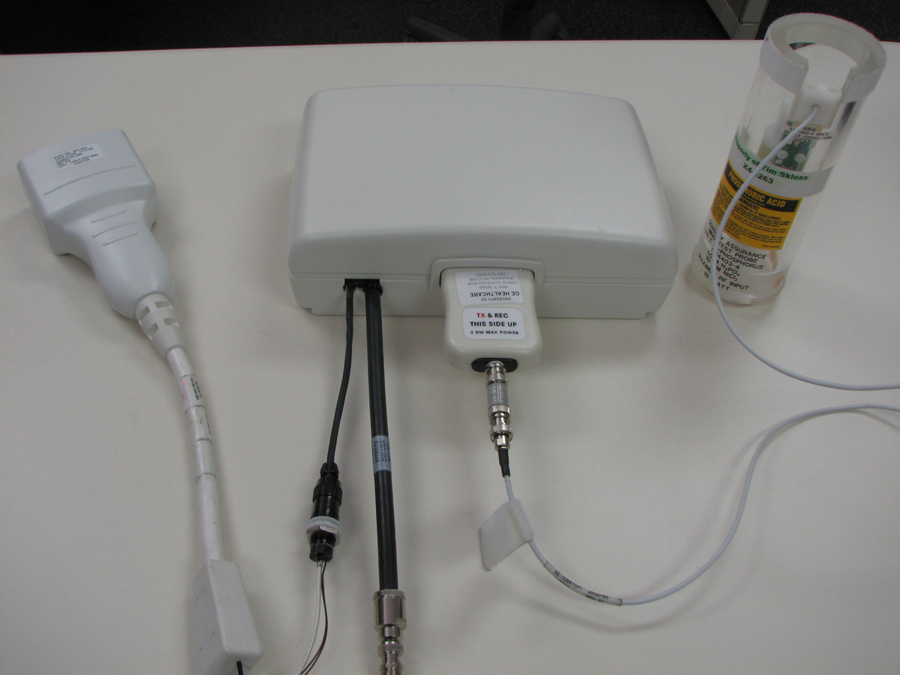
Scanner setup
Procedure
- Click .
Figure 4. CV display example pw_rf1 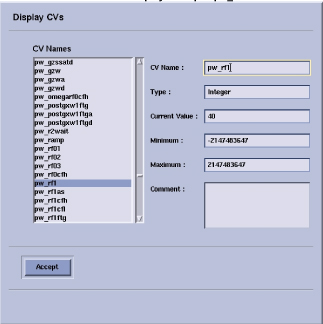
- Click Start. After a few seconds you should see a peak in the top display and a free induction decay (FID) in the bottom display as shown below.
Figure 5. Typical prescan signal for 31P (left) and 13C (right) at 3.0T 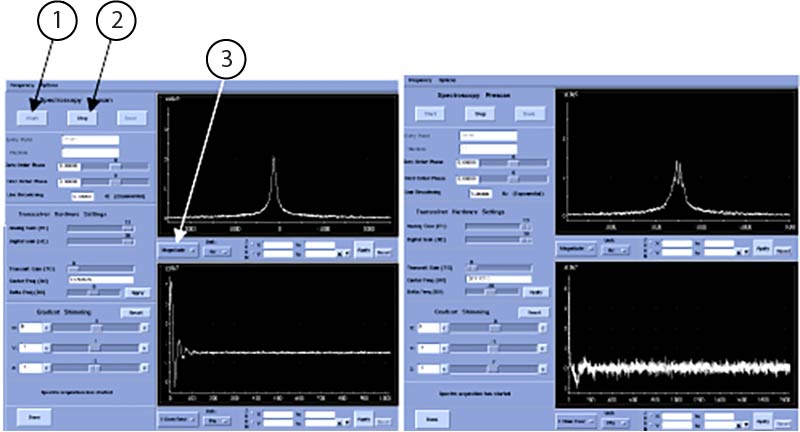
1 Start 2 Stop 3 Magnitude 13C spectrum is four closely spaced peaks and has been centered.
- Adjust the center frequency to center the peak in the Magnitude window using Delta Frequency DX . After each adjustment click Apply. Note:
If you see nothing but noise in the Magnitude window, you may be off frequency for MNS. See the following ratios for calculating the correct center frequency.
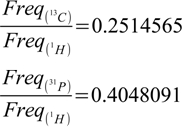
Table 2. 3T center frequencies Isotope Center frequency (Hz) reference frequency 1H 127,732,407 2H 19,607,704 3He 97,345,529 7Li 49,645,367 11B 40,988,944 13C 32,125,190 15N 12,951,797 17O 17,322,806 19F 120,232,710 23Na 33,808,565 29Si 25,396,354 31P 51,754,323 55Mn 31,728,754 129Xe 35,328,351 - Use the ZOOM mode functions to measure the Magnitude peak height.
Figure 6. Measuring with zoom mode 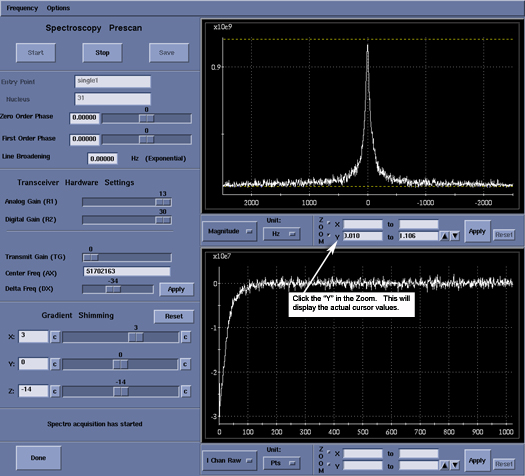
Signal to noise test
About this task
Hardware setup
Procedure
- Install the T/R module onto the top of the LPCA cover.
- Place the grafidy base plate on the patient bed near the top of the bed.
- Place the QA probe in the center hole of the grafidy base plate and lock the probe into place.
- Connect Inner DC Block to BNC connector. See Figure 3.
- Connect the QA probe cable to the quick disconnect module.
- Connect the QD module to the T/R module.
- Landmark on the center of the QA probe and advance to scan.
Scanner setup
Procedure
- Use the Zero Order Phase control to adjust the shape of the peak until it is fully positive and symmetric. The Zero Order Phase control was used to correct the spectrum until all signals were positive and the peak shape was symmetric.
Figure 7. Typical uncorrected (left) and corrected (right) “Pure Absorp” (31P peak shape) 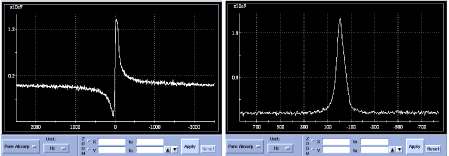
- Decrease TG slowly until the peak is split half-positive and half-negative.
Figure 8. Example of half-positive and half-negative 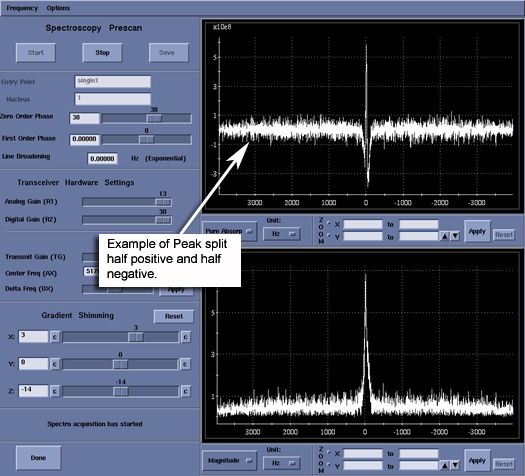
Scanning and analysis
Procedure
- Type sage and click Enter to initiate the SAGE spectroscopy analysis tool.
Figure 9. Example of sage tool 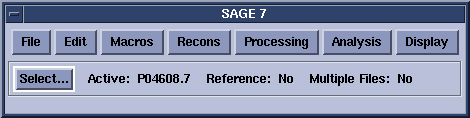
- When the scan is finished, click Update List to refresh the list of P files to choose from.
Figure 10. Example of raw load window 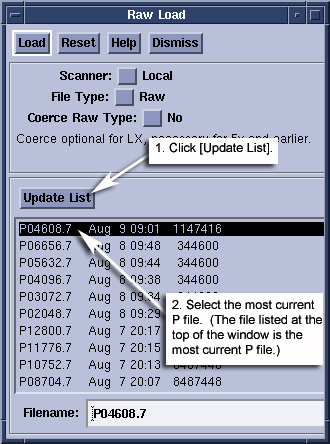
- Move the windows around if necessary.
Figure 11. SNR test window 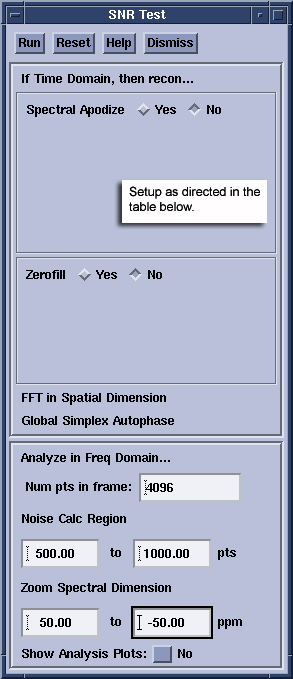
- Click Run on the SNR Test window. The SNR is calculated for the active data set and reported in the command window where SAGE was started.
Figure 12. Example of data set 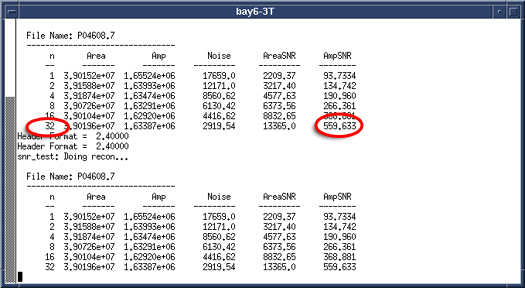
Noise test
About this task
If the Functional Test procedure, Functional test, has successfully completed and you now want to begin the Noise Test, select Noise Scan from the MNS Setup area and select Setup. Then proceed to Step 9.
Hardware setup
Procedure
- Install the TR module onto the top of the LPCA cover.
- Connect the cables to the A connector on the LPCA.
- Place the grafidy base plate on the patient bed near the top of the bed.
- Place the QA probe in the center hole of the grafidy base plate and lock the probe into place.
- Connect Inner DC Block between the QA probe cable and the quick disconnect module. See Figure 3.
- Connect the QD module to the TR module.
- Landmark on the center of the QA probe and advance to scan.
Scanner setup
Procedure
- Turn the RF ENABLE switch on the MNS exciter OFF by flipping it down.
Figure 13. Location of RF switch on MNS exciter 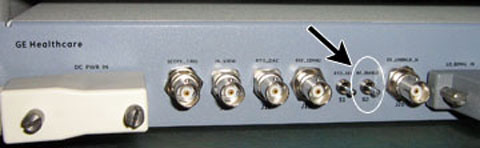
- Click Start. After a few seconds you should see a band of noise across the power spectrum. There should be no distinct broad peaks across the spectrum. The noise intensity should taper off near the edges.
Figure 14. Noise test power spectrum in spectro prescan 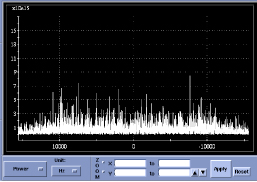
Scanning and analysis
Procedure
- Type sage, and then click Enter to initiate the SAGE spectroscopy analysis tool.
Figure 15. Sage window - Click on to open the Raw Load data dialog window.
Figure 16. Raw Load data window 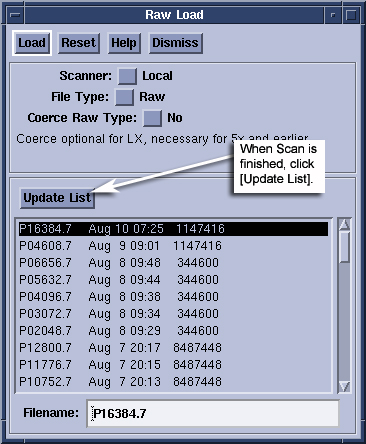
- Set up the SNR Test window as listed in Table 4 for nucleus under test.
Figure 17. SNR Test window 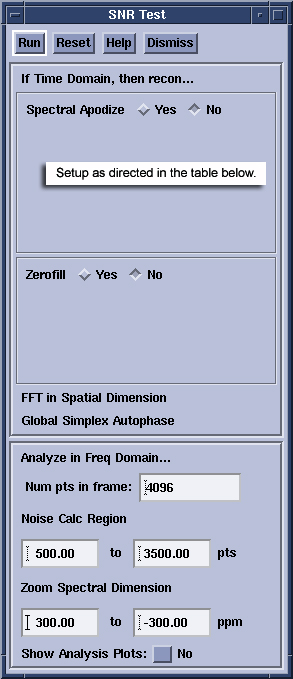
Table 4. SNR Test panel settings for noise tests Field 13 C setting 31 P setting Spectral Apodize NO NO Zero Fill NO NO Num pts in frame 4096 4096 Noise Calc Region 500 to 3500 500 to 3500 Zoom Spectral Dimension (3T) 480 to –480 ppm 300 to –300 ppm Show Analysis Plots NO NO - Record the n=32 value for Noise. Compare to the maximum acceptable.
Figure 18. Example of noise data 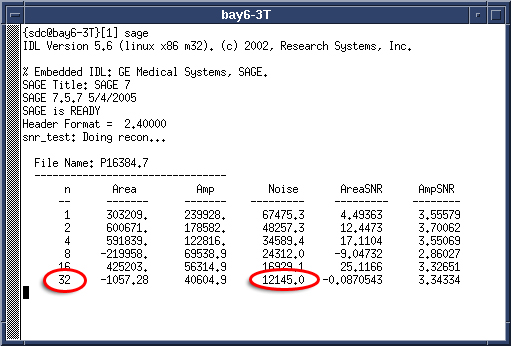
- The spectrum should be flat across the window with tapering to zero at each edge as shown in Table 1. Broad peaks in this window suggest unwanted noise in the scan room. Use this test as a tool for tracking down noise sources if found. There should be no distinct broad peaks across the spectrum. The noise intensity should taper off near the edges.
Figure 19. Noise test power spectrum following calculations in SAGE 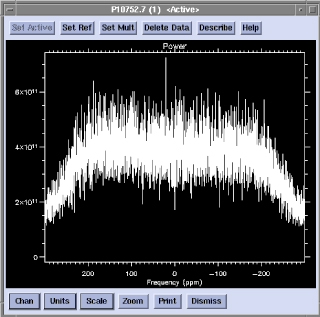
Finalization
Procedure
- Remove any hardware used during system testing.
- Do a test scan of the system to make sure it is operating correctly.