
- SIGNA MR355 / SIGNA MR360
- Service Manual
- 5856356-3EN Revision 5.0
- Basic Service Documentation. Copyright General Electric Company.
- 00000018WIA30538F20GYZ
- id_131075812.0
- Jul 19, 2019 11:00:12 AM
Grafidy3 Procedure
Prerequisites
| Required persons | Preliminary requirements | Procedure | Finalization |
|---|---|---|---|
| 1 | Not Applicable | 1 Hour for Base System minutes | Not Applicable |
| Item | Quantity | Effectivity | Part number | Manufacturer |
|---|---|---|---|---|
| Grafidy Kit | 1 | 1.5T |
5135527 | - |
| Item | Quantity | Effectivity | Part number | Manufacturer |
|---|---|---|---|---|
| RF Coil Assembly | 1 | 1.5T |
5135514 | - |
| ||||
| Condition | Reference | Effectivity |
|---|---|---|
| - | - | |
|
DQA II | - | - |
Hardware Set-Up
Procedure
- Plug the Hypertronics connector into the Port A. SeeFigure 1 . (The Green Coil ID light will come on.)
Figure 1. Grafidy Hardware Setup 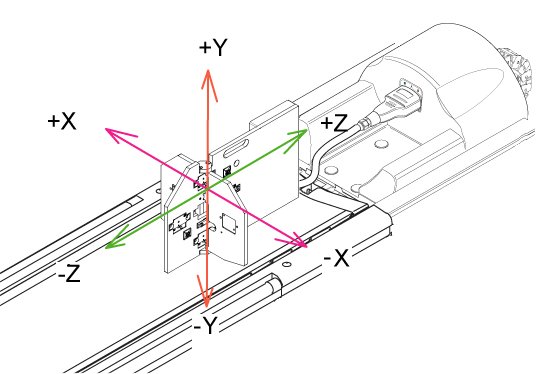 Note:
Note:The very first time a Grafidy Coil is connected to the system, a popup (See Figure 2) may announce that “A New Coil Is Connected”. Click the Yes button to add the coil configuration to the system. You shouldn't see this message again unless software is reloaded.
For HDe System, Grafidy Coil is connected during staging. So, this message won't come up even during installation.
Figure 2. A New Coil Is Connected Popup 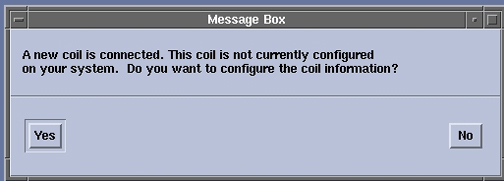
- Center the laser cross hairs on top of the fixture (As shown
in Figure 3) . Landmark the system and press Advance
to Scan.
Figure 3. Grafidy Tool And The Centering Point 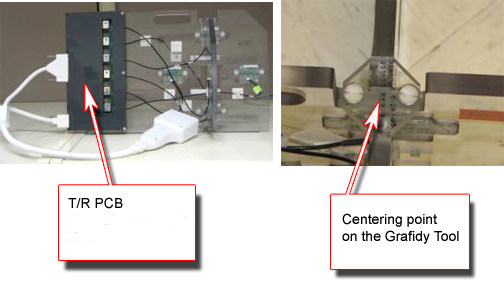
Running Grafidy 3
Procedure
- If you receive the message shown inFigure 4 about “Short TC Cal Values”, click Yes.
Figure 4. Default Short Cal Values Popup 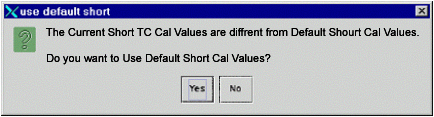
- Click on the Auto Mode tab. See Figure 5. All three-coil axes will be selected. Click the Scan button to start the calibration. (When the scan is active, you can
stop it by pressing the Abort button and the
“STOP” button on keyboard.)
Figure 5. Auto Mode Setup 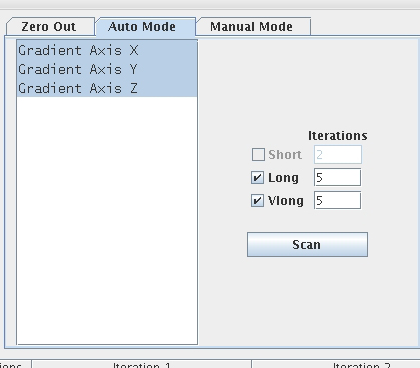 Note:
Note:When in Auto/Manual Mode, a number of signal checks are performed to ensure the proper state of the grafidy fixture. The following signals are examined from every channel and an error is reported if a problem is found. The signals are as follows:
-
Position.
-
SNR.
-
Signal Saturation.
-
- If you receive the message shown in Illustration 7 about “Short TC Cal Values”, click Yes. See Figure 6.
Figure 6. Default Short Cal Values Popup 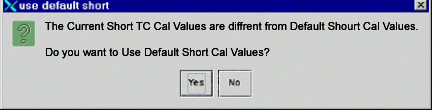
- Review the numeric output values from the auto mode scan. Verify
that the results of final iteration for each component are below specs
(green). SeeFigure 7 for help in reading output values.
Figure 7. Reading The Output : The specs and the Actual values (Smoothed) are shown circled. 
Manual Mode
About this task
Use Manual Mode when Auto Mode fails to bring one or more of the terms into specification. Manual Mode lets you iterate through the process yourself, and decide when to stop.
Procedure
- Select the [Manual Mode] tab.Figure 8 shows this.
Figure 8. Manual Mode Tab 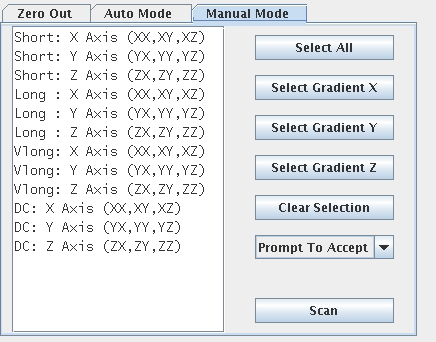
- If the “Prompt To Accept” mode is active, after
the scan is complete, a graph of the results will pop up (see Figure 9). In order to learn about “Prompt To Accept” refer
to Grafidy 3 Tools, section
7, manual mode.
Figure 9. Results Window With Accept/Cancel Buttons 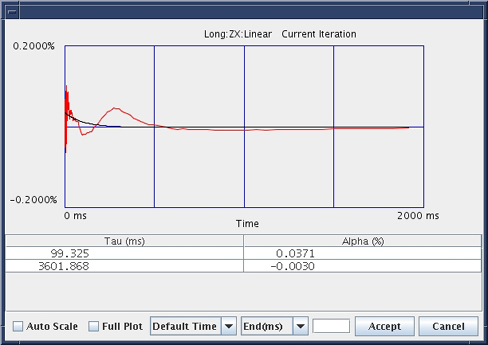
Finalization
Procedure
- Remove Fixture from the system.
- Exit the Software Tool.