• SIGNA MR355 / SIGNA MR360
  • Service Manual
  • 5856356-3EN Revision 5.0
  • Basic Service Documentation. Copyright General Electric Company.
  • Object ID: 00000018WIA30C48F20GYZ
  • Topic ID: id_13105827 Version: 2.0
  • Date: Jul 19, 2019 11:00:23 AM

Dummy Load and Cables Calibration

Prerequisites

Table 1. Personnel requirements
Required personsPreliminary requirementsProcedureFinalization
1Not Applicable30 minutesNot Applicable
Table 2. Tools and test equipment
ItemQuantityEffectivityPart numberManufacturer
50-ohm dummy load, 200 watt, 30 dB attenuator - Bird Model 8322 (or equivalent).1-

46-317724P14

-
RF Test Cables Kit1-

46-255816G1

-
Exciter 3 RF System Cabinet Service Cable Kit1-

5117087

-

About this task

This procedure provides directions for determining the true loss attributable to the dummy load and cables used when measuring the RF output power with oscilloscope of 100 MHz bandwidth or greater. It is necessary to know and account for the actual loss these components contribute in order to accurately measure RF power. This procedure is not needed if using the RF Power Measurement Kit. The RF Power Measurement Kit has already been calibrated so that this loss is known and accounted for.

Note:

WHEN MEASURING HIGH FREQUENCY (IN THIS CASE, 64 MHZ ) ON ANY 100 MHZ SCOPE, THERE MAY BE AN ERROR DUE TO THE BANDWIDTH LIMITATIONS OF THE SCOPE. (IF NECESSARY, READ ‘SCOPE TRIVIA’ AT THE END OF THIS PROCEDURE.)

Overview

Procedure

  1. Test cables long enough to reach the cables, connectors and dummy load to be tested are connected between the Exciter RF Output(J12) and CSA RF Input (J14). Receiver gains (R1 & R2) and transmit gain (TG) are set for near full scale reading on the power spectrum during prescan calibration. A reference scan is taken and stored in a raw file. The Attenuation Test Tool is used to calculate the baseline factor from the reference scan for the test cables (i.e., there is some loss from the test cables).
  2. The dummy load and/or cable(s) to be tested are next inserted in series with the test cables and another scan is taken. Again, the Attenuation Test Tool is used to determine the “Magnitude Squared Attenuation Factor” (i.e., how much has the test signal been attenuated). This attenuation factor is used in the RF power calibration process to accurately calculate the RF power level.
    Note:

    If any problems are encountered during the following procedure, always start over at the beginning and re-do the reference scan. Then you may add, as directed in this procedure, any type of attenuation hardware you might have reason to test.

Initial Setup

Procedure

  1. Disable the TNS Function. See Stopping and Starting TNS Function for the procedure to shutdown the TNS Function.
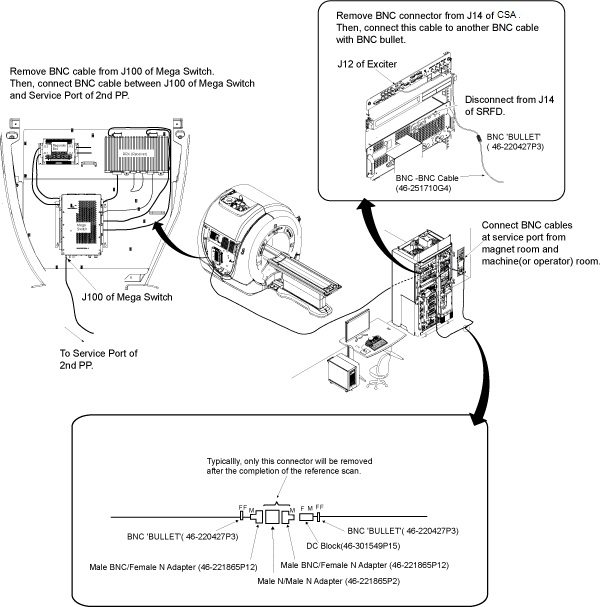
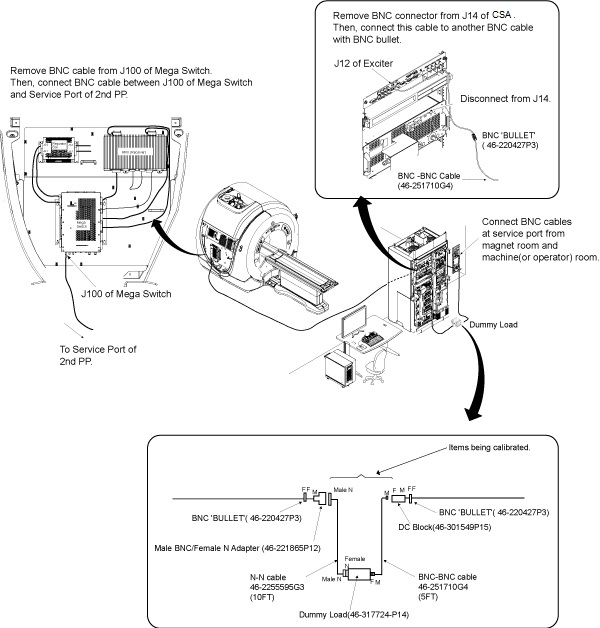
  2. Reconfigure test hardware as shown in Figure 1.
    Figure 1. CONNECTIONS FOR INITIAL AMPLITUDE SCAN
    Note:

    Adapters not shown in Figure 1 can be added, if necessary, from the RF Cables Kit. Usage of the inline DC Block as shown in Figure 1 is mandatory.

  3. Disconnect the existing cables at the J14 of CSA and at the J100 of Mega Switch.
  4. Connect the assembled test cables and adapters between Cable disconnected from J14 of CSA and BNC cable from Service Port of second Pen Panel.
  5. At the operator work space, prepare the system for a Dummy Load scan using the procedure, see below.
    1. Click the Scan New Pt buttons.
      Figure 2. New Patient Icon
    2. Patient Id: geservice, and then press Enter.
    3. Weight (Lb): 111, and then press Enter.
    4. Choose Show All Protocols... and then Service. Select 1.5T dummy load cal, click the center arrow, and then click the Accept button.
    5. Click the Start Exam button.
    6. Set a landmark.
    7. Click Advance Scan.
    8. Click Save RX.
    9. Select the Research Options from the drop down next to the Scan button, then select Display CVs.

      Set value of CV calmode to 2 (trapezoid pulse), then click Accept key.

      (Caution here. Make sure the previous CV has been cleared before entering the next one. Look at the screen!)

      Set value of CV p2_ramp to 1 (1 µsec ramp time), then click Accept key.

      Set value of CV t2 to 50000 (50 msec tr), then click Accept key.

      Set value of CV pismode to 1 (exc service), then click Accept key.

      Set value of CV pmode to 1 (data collection), then click Accept key.

      Set value of CV daqm to 1 (data in window), then click Accept key.

    10. Select the Research Options from the drop down next to the Scan button, then select Download then select Manual Prescan.

Data Collection

Procedure

  1. When in Manual Prescan, set R1 to 7, and R2 to 13.
  2. Adjust transmit gain (TG) to achieve an R1 or R2 (on IP display) of approximately 98%, without going over.
  3. Select Done.
  4. Select Scan (Ignore the message: MR signal too large, reduce receiver gain.) (Note: on the LX systems tested, the scan time starts at 13 seconds, counts down to 7 seconds, then ends. This is normal and is not cause for alarm.)
  5. From the Service Desktop Manager, open service browser and select utilities, and then [Attenuation Test], and then Click here to start this tool.
  6. Use Attenuation Test tool selection to analyze data, as shown in Table 3.
    Table 3. DATA COLLECTION
    Output/Prompts Input/ Comments
    Last run number used was: XXXX
    Please enter runfile number (XXXX): ..... Enter
    Please select Locked / Unlocked file (L,U) (U):.......... Enter (working)
    ****************************************

    ******************************************

    Average Max. magnitude Across All Views = aaaaa

    Average Max. magnitude Squared = bbbbb

    Average RMS Across All Views = ccccc

    ******************************************

    Do you want to make this run the reference(Y,N)(N):...... Y Enter
    STOP! Do not answer the next question at this point. Continue with Step 7 below.
  7. The next step will involve removing the center male N to male N adapter and male BNC to female N adapter from the test cables, setting it aside, and adding in the dummy load and cables that need to be characterized.
  8. Connect your test cables to the opposite ends :Figure 3 - Dummy Load and Cables
    Figure 3. CONNECTIONS FOR DUMMY LOAD + CABLES SCAN
    Note:

    "Bullet" RF connector referred to in Figure 3 is a female BNC/female BNC adapter, 46-220427P3.

  9. Select the scanning icon again to activate the scanning screen.
  10. Select Scan.
  11. When the scan is completed, continue with Analysis in Analysis..

Analysis

Procedure

  1. See Table 4.
    Table 4. ANALYSIS
    Output/Prompts Input/Comments
    Do you want to compute Gain or Attenuation Ratio(G,A)[G]: A Enter IMPORTANT: Answer after the scan is done.
    Please do the next scan…
    Press enter key to continue, s or q to quit []: Enter
    Last run number used was: XXXX
    Please enter runfile number [XXXX]:....................... Enter
    Please select Locked/Unlocked File (L/U) (L).....
    *********************************

    ***********************************

    Average Max. Magnitude Across All Views = aaaaa

    Average Max. Magnitude Squared = bbbbb

    Average RMS Across All Views = ccccc

    Magnitude Attenuation Factor = xxxxx

    Magnitude Squared Attenuation Factor = yyyyy

    RMS Attenuation Factor = zzzzz

    Record yyyyy value in Table 5
    Do you want to make this run the reference(Y,N)(N):...... N Enter
  2. Record the “Magnitude Squared Attenuation Factor” number and record it in the appropriate Value box in Table 5.
    Table 5. ATTENUATION FACTORS
    MODECALIBRATED HARDWARE PART NUMBER(S) VALUE NOMINAL VALUES
    BODY OR HEADDUMMY LOAD + CABLES ATTEN FACTOR46-255595G3 46-317724P14 46-251710G4 931 TO 1200

Calculation of RF power

Procedure

  1. Peak voltage should be used in the calculation in order to get an accurate result. It can be converted to power using the following formula as long as certain factors are known and accounted for. The scope correction factor MUST be known. So must the actual total loss attributed to anything that connects the measuring device to the source. This often includes the accumulated loss associated with the dummy load and any interconnecting cables. Table 6 shows the calculation of power if all the attenuating devices in the measurement circuit exhibited perfect loss; that is, the devices added no more or less loss than what they were designed to provide. Table 7 shows the same calculation of power but accounts for the measurement-circuit loss values in deriving the true power. Note that the loss has a significant impact on the calculated power.
    Note:

    THE SCOPE CORRECTION FACTOR MUST BE KNOWN FOR THE FORMULAE SHOWN IN Table 6 AND Table 7. IF IT IS NOT KNOWN, DO NOT USE THIS METHOD. GROSSLY INACCURATE MEASUREMENTS AND POSSIBLE SYSTEM DAMAGE WILL RESULT.

    Table 6. RF POWER CALCULATION WITH NO LOSS
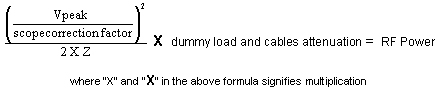
    Assume Z = 50 Ohm, Vpeak = 31.62, scope correction factor = 1.00 (no loss), dummy load and cables atten. = 1000, (dummy load and cables are all ideal)

    This result assumes a theoretically perfect situation in which there is no loss. These situations, in common practice, rarely exist!
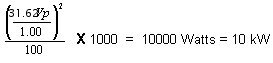
  2. Now, consider the "real life" type situation in Table 7 in which the loss is considered:
    Table 7. RF POWER CALCULATION WITH LOSS CONSIDERED

    Assume Z = 50 Ω, Vpeak = 27.36, scope correction factor = 0.88, dummy load and cables atten. = 1028

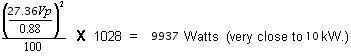
    Accounting for the loss resulted in an accurate answer. 9937 Watts is as close as we can hope to get to 10000 Watts without using the RF Power Measurement Kit. Note that if none of the loss (If considering 0.88 as 1.0) had been accounted for the error could have been 2242 Watts or 22.6%. As a result, the observer would attempt to adjust the RF power far above the 10000 Watt limit!

System Restoration

Procedure

  1. Reconnect original cables to the SRFD J14 and Mega Switch J100.
  2. Enable the TNS. See Starting TNS Function.
  3. Perform a TPS Reset to set the MGD back to imaging mode so that the system will be able to scan. Failure to do this will result in Autoprescan failures due to a loss of receive signal.
  4. Perform one satisfactory head or body scan.

Wattmeter Trivia

Procedure

  1. Why are measurements between a oscilloscope and a Bird Wattmeter found to be different? Repeated GEMS Education Center lab groups that performed the Dummy Load and Cables attenuation process correctly, and obtained an accurate attenuation value, were able to accurately measure RF power as well as with a 400 MHZ scope! Remember, for wattmeter measurements however, the meter reading must be multiplied by the atten factor. Leaving this little factor out is the reason why the above ‘note’ was made. In body mode the wattmeter is placed after the dummy load. Its atten value must be used to calculate the correct RF value. If it is NOT used, then it should be expected there will be an error of 10% or more!
  2. In head mode, the wattmeter is placed before the dummy load. In this case only the ‘cable’ factor is used to correct the wattmeter reading. The ‘cable’ factor is the other atten test you did for the 10 foot cable only. Typically that value is between 1.0 to 1.2. Doesn’t sound like much???? Take your calculator out for a moment. Take 2,000 watts (displayed reading) and multiply by an atten factor of 1.0 ; the results are obvious, 2,000 watts. Now take the same displayed 2,000 and multiply it by an atten factor of 1.2 = 2,400 watts! Hopefully this example will show the importance of the attenuation values. You just calculated a 20% error if you were wrong because you didn’t do atten test on the 10 foot cable!

Scope Trivia

Procedure

  1. A basic ‘rule of thumb’ in the scope industry is that ‘to accurately measure a high frequency signal, the bandwidth of the scope should be at least 5X the frequency being measured’. That means that for a 64 MHZ signal the scope bandwidth would have to be at least 320 MHZ. This is why the 400 MHZ scope was chosen several years ago for MR use. Knowing this should alert you as to what might have to be done in order to get correct scope readings from whatever scope you carry today. Who knows what bandwidth scope you’ll be working with tomorrow? Will it be of sufficient bandwidth to give accurate measurements? What can you do if it is not covered by the rule of thumb? Read on!

    Experimentation with multiple scopes have shown that an error is typically somewhere between 0 and 16%. That’s right, some 100 MHZ scopes have no loss! Others may have as much as 15 or 16%. Additionally, it has been found that it is not necessarily the whole scope that has this loss, but the individual channels typically exhibit differences. In other words, channel one might have a 3% loss when channel two could lose 15%. There is no fixed number for all 100 MHZ scopes!

    How do you get around these losses? Well, there are two ways. First you could compare a RF waveform on your scope, side by side, with a 400 MHZ scope. Use the same cables etc. and just move the cables from scope to scope. You can then calculate the loss for each channel of the 100 MHZ scope vs. the 400 MHZ scope. Keep the scope intensity low for best accuracy. If and when possible, determine the loss for a 1.5T system for 64 MHZ. Point of note: there are various losses at 64 MHZ. And, typically they differ! Your scope may have a 0 to 15% rolloff at 64 MHZ. All scopes differ!

  2. Secondly, the next time you have your scope calibrated, just attach a tag asking for the % loss of signal at 64 MHZ for each channel. You should also state that you want this to be done at the 5 and 2 volts/div setting. This will cover both body and head measurements. At two different re-calibration vendors we use, there are no extra charges incurred for this request.

    As mentioned above, the 100 MHZ scope has been shown to be as accurate as a 400 MHZ scopes if the scope rolloff factor is known. Additionally, each channel has it’s own unique loss factor.

    The biggest error found in GEMS Education Center labs when measuring RF power has proven to be the FE using “typical” dummy load and cables attenuation factors. Basically there are no “typical” factors! All loads and cables are somewhat different. Several may appear to be close in value, but in most cases they are different. If you use a “typical” atten factor in your calculations, then ”typically” you will be in error.

    Through experimentation at the GEMS Education Center, it has been determined that if you know the attenuation factor for a particular dummy load and cables, those values hold over several years. They do NOT tend to change. This means that if you could do atten test on a dummy load and cables, and keep them as a kit, you don’t have to recalibrate them every time you use them. Wow! And possibly a little cheaper than the Power Measurement kit.

    If you must, or intend to use a scope to measure body RF power, use atten test on the dummy load and cables.

    Knowing the correct attenuation values and the correct scope rolloff values will provide you with measurements as accurate as a 400 MHZ scope and / or the GE Power Measurements kit.

What to do next

About this task

No finalization steps.