
- SIGNA MR355 / SIGNA MR360
- Service Manual
- 5856356-3EN Revision 5.0
- Basic Service Documentation. Copyright General Electric Company.
- 00000018WIA302ADD20GYZ
- id_131061223.0
- Aug 29, 2019 1:52:33 AM
Surface Coils SNR Test
Prerequisites
| Required persons | Preliminary requirements | Procedure | Finalization |
|---|---|---|---|
| 1 | Not Applicable | 30 minutes | Not Applicable |
About this task
This procedure is used for several coils. Open the Coil SNR tool as shown in Figure 1, click on the square tab on the right side of the Coil selection to determine which coils are available to use with this tool.
Procedure
- Select the coil type you want to run, then select Start Scan. See Figure 1. This illustration shows an example using the 8 channel Torso coil.
Figure 1. Coil SNR tool 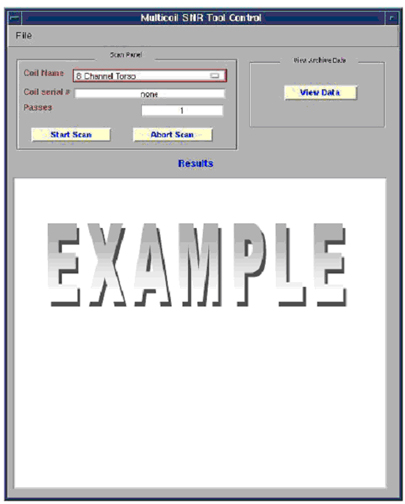
- When the scan completes, the SNR data will be displayed in the
Multicoil SNR Tool Control window. Each ROI returns an individual
result with a pass or fail indication. See Figure 2. The results are automatically recorded as files in /usr/g/service/data. Please refer to this directory for a history of functional tests
performed on a specific system. The individual receiver images and
composite image are saved in the system. The signals used to calculate
SNR are taken from the composite image. Signal images are acquired
using a SE sequence with CV saveinter set to 1 to save intermediate
images into the image database.
Figure 2. SNR Results 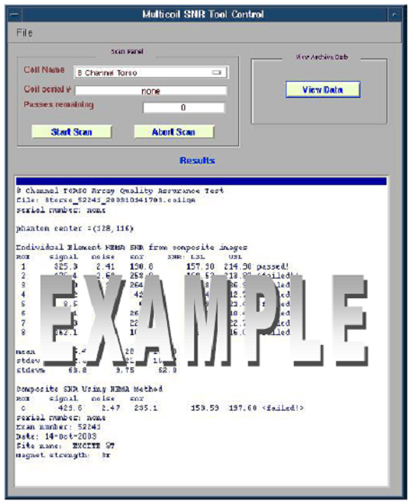
Figure 3. Example Individual Receiver Images And Composite Image For CTL Coil 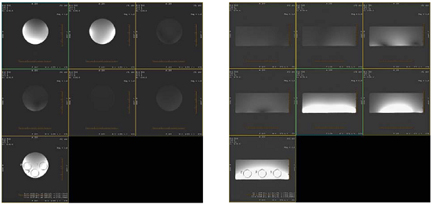
- For most coils, a plot of the results will appear in a separate
window. This also will display automatically. The Upper Spec and Lower
Spec lines appear in red with the current test results shown in blue.
See Figure 4.Note:
The USLUpper Spec Limit can be ignored. This limit will be removed in future versions of EXCITE software.
Figure 4. SNR Plot 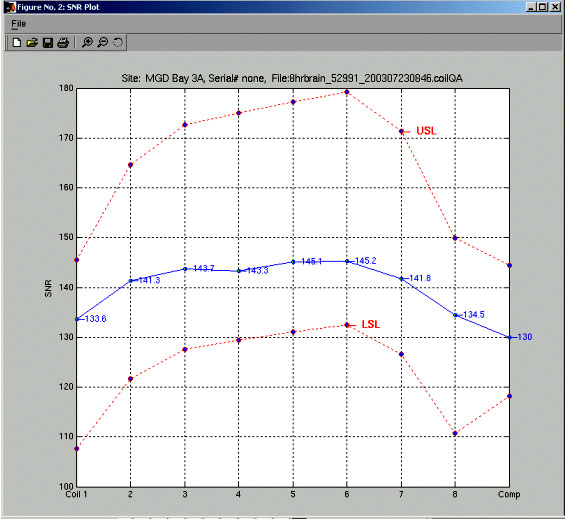
- Optionally:
- To view the most recent plot data again or previous results,
click on view data. The following GUI will appear. See Figure 5
Figure 5. View Data 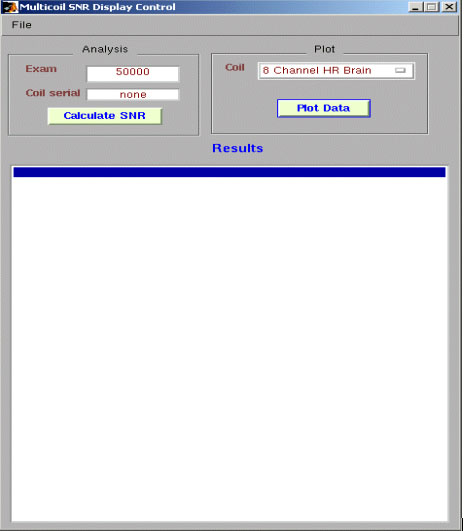
- To view the most recent plot data again or previous results,
click on view data. The following GUI will appear. See Figure 5
- To recalculate the most recent exam SNR results, enter the correct
exam numer in the Exam Field under the Mulitcoil SNR display control
GUI, then click the Calculate SNR button.
SeeFigure 6 and Figure 7.
Figure 6. SNR plot data Figure 7. SNR value data 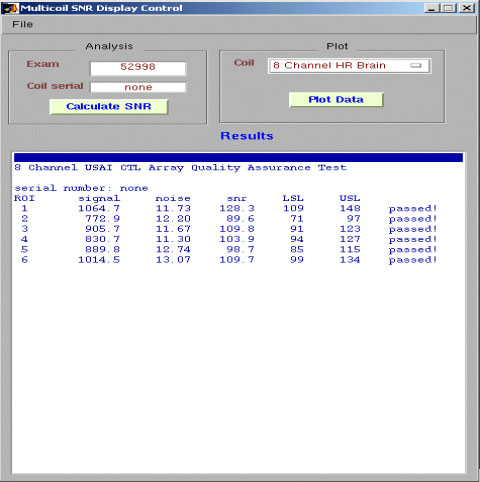
Finalization
No finalization steps.