- SIGNA MR355 / SIGNA MR360
- Service Manual
- 5856356-3EN Revision 5.0
- Basic Service Documentation. Copyright General Electric Company.
- 00000018WIA30A27640GYZ
- id_20144924.0
- Feb 21, 2021 9:06:13 PM
Grafidy - Examine fit
Allows examination of field error data curves to monitor progress and debug issues.
About this task
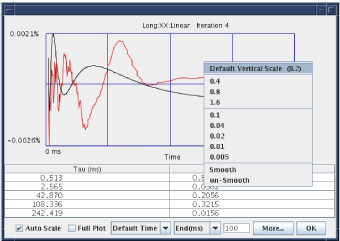
It is useful to occasionally examine the field error data curves to monitor progress and debug any issues. To view a plotted scan, select a populated cell and click Show. The measured data is plotted in red. The best-fit curve is plotted in black. For long mode data, by default the vertical axis is set to ±0.2% and the horizontal axis is displayed from 0–2 seconds. For very long mode data, by default the vertical axis is set to ±0.2% and the horizontal axis is displayed from 1-150 seconds. For short mode data, the vertical axis is displayed from –20% to 120% by default for linear on-axis data. The vertical axis for short B0 data defaults to ±0.2%. Both short mode data types default to a –1500us to 500us horizontal axis display.
Functions have been provided to allow manipulation of the plot axes.
Procedure
- [End (ms)] pull down - The [End (ms)] pull down list, and the text box next to it, let you define the minimum and maximum axis display limits for both the vertical and horizontal axes. Select the desired entry from the list and enter the value in the text box to update the display. The image below shows an example of the appearance of a data curve before and after setting the end time of the horizontal axis to 100ms.
Figure 1. Examining fit 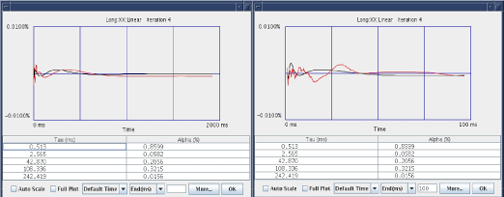
- Smooth or Unsmooth - These options are available when you right-click on the plot and control whether the data is shown after or before a multi-point sliding averaging window has been applied to the data. The default mode is to display the smoothed data. All pass/fail checks are performed on the smoothed data. Display the unsmooth data to see an indication of how the smoothing operation affected the data being used by the tool.
Figure 2. Setting auto scale mode