
- Discovery MR750w and SIGNA™ Architect T 3.0T System Service Methods
- 5690002-2EN Revision 4
- 00000018WIA30C21130GYZ
- id_123743621.3
- Jul 5, 2019 10:03:33 PM
System Level Correlated Noise Check
Prerequisites
| Required persons | Preliminary requirements | Procedure | Finalization |
|---|---|---|---|
| 1 | Not Applicable | 1 hour | Not Applicable |
About this task
Overview
Correlated noise is phase and frequency coherent noise sources that correlate to clocks and other digital signals which are generated internal to the magnetic resonance imaging (MRI) system. These noise sources cause undesirable constant frequency lines (noise "zippers"), or bright spot ("hot" pixel cluster) type artifact in MR images. These problems are usually caused by poor screen room integrity or grounding problems. To check the correlated noise, perform the following tests:
-
Place the Head Coil on the table and landmark as usual.
-
Place the RF ENABLE switch on the front of the Exciter module in the Disable (down) position to disable transmit radio frequency (RF) output.
-
Take nine scans with R1=11, 256matrix. Prescribe each scan location as I1000. This will result in the Head Coil moving outside the bore upon starting the scan.
-
Take nine more scans with R1=7. Prescribe each scan location as I1000.
Note: -
Take one scan at the magnet frequency with the R1=11, 512 matrix. Then, take one more scan at the magnet frequency with the R1=7, 512 matrix.
-
Analyze all images for artifacts.
Scan Preparation
Procedure
- Disable RF output by placing the RF ENABLE switch on the front of the Exciter module in the Disable (down)
position. See Figure 1.
Figure 1. RF OUT - Disable/Enable Switch 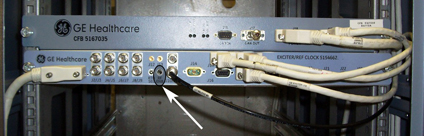
Correlated Noise Data Analysis
Procedure
- Note:Background Mean and Standard Deviation. Using the Image Browser, measure and record the Mean and Standard Deviation for the first R1=11 image and the first R1=7 image of each image set (both 256 matrix and 512 matrix scans), per the following steps. If you wish, record Mean and Standard Deviation values for the other images.
Images must be viewed in an unmagnified format.
- Position a circular cursor from [Measure] so that it is in the
center of the image area. Using the size/shape handle, set the circular
size for an area of approximately 1200 mm2 (see Figure 2).
Figure 2. Correlated Noise Image 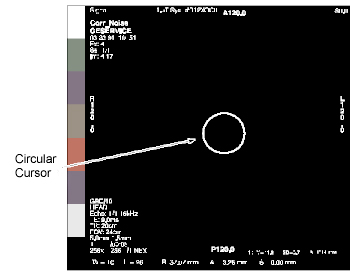
- Record the mean value
 and standard deviation value (SD) displayed on screen in Data Sheet. (PDF)
 - Calculate pixel acceptance guidance value: (Pi) limit = + 8 (SD), for first R1=11 and R1=7 256 matrix scans, and for both 512 matrix scans. Record these four values in the Acceptance Guidelines - Pixels (Pi) column in the data sheet. (PDF)
- Position a circular cursor from [Measure] so that it is in the
center of the image area. Using the size/shape handle, set the circular
size for an area of approximately 1200 mm2 (see Figure 2).
- Zipper Peak Pixel (Perform if zipper is present
in image.)
- Calculate using measured and (SD) data from appropriate data sheet: + 6 (SD). Record result in appropriate data sheet, Acceptance Guidelines,
PZ column. Check that measured Zipper Peak
Pixel (PZ) is less than or equal to the calculated
guideline.
- Calculate using the measured and (SD) data from the appropriate data sheet:
- 6 (SD). Record the result in the
appropriate data sheet, Acceptance Guidelines, PZ column. Verify that the measured Zipper Peak Pixel (PZ) is greater than or equal to the calculated guideline.
- Calculate using measured
- Zipper Mean (Perform if the “zipper” is present
in the image.)
- Position a rectangular box from Measure so that it covers only the area (and not beyond) of a zipper (or section of a segmented zipper).
- Record the mean value (Z) of the zipper in the data sheet.
- Calculate using the measured data from the appropriate data sheet: + 3. Record in the data sheet (PDF) Acceptance Guidelines, Z column. Verify that Zipper Mean ( Z) is less than the calculated guideline.
Note:If the results of the data for "hot" pixels and zippers do not meet the Acceptance Guidelines in the Data Sheet, use the appropriate procedures to troubleshoot the system.