- id_2001823
- Version: 7.0
- Date: Aug 23, 2019 3:42:42 AM
EPI White Pixel test data
The following table indicates how the logical to physical gradients are played out in Mode 1 operation. It also indicates which images from Mode 1 are using what scan plane. This is useful information to know when using this tool in Mode 1 or in Mode 2.
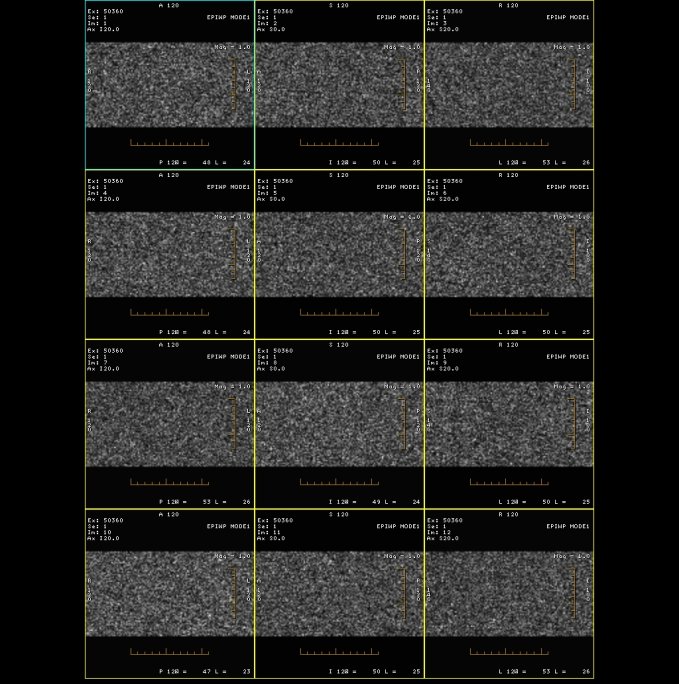
Typically the frequency encode axis is the one that generates the spike noise because that is the axis that has the high amplitude, high duty cycle Echo Planar Image (EPI) readout train. This is not always the case, however, as we have seen the phase encode axis cause problems in defective gradient filter boxes. If the White Pixel images are displayed in a 3x3, 3x4, or 3x5 format, Axis Specific Gradient Information or scan plane is displayed per column.
note: If a specific column has high white pixel values, the problem may be related to a specific gradient.
| Body | |||||
|---|---|---|---|---|---|
| Image Displayed | Image Plane | Logical Frequency Axis | Logical Phase Axis | Logical Slice Axis | Time Order of Acquisition |
| 1, 4, 7, 10, 13, 16, 19, 22, 25, 28, 31, 34, 37, 40, 43, 46 | Axial | Phys X | Phys Y | Phys Z | 1 |
| 2, 5, 8, 11, 14, 17, 20, 23, 26, 29, 32, 35, 38, 41, 44, 47 | Sagittal | Phys Y | Phys Z | Phys X | 2 |
| 3, 6, 9, 12, 15, 18, 21, 24, 27, 30, 33, 36, 39, 42, 45, 48 | Coronal | Phys Z | Phys X | Phys Y | 3 |
Figure 1. Gradient Information