- id_12373498
- Version: 1.1
- Date: Jul 5, 2019 10:03:33 PM
Coherent Noise Theory
Coherent noise, in relationship to MR image quality, is the presence of detected frequencies by the MR system that are within the receive bandwidth, but are not the generated signal from the area being scanned.
The SPT Coherent Noise test provides a way to detect the presence of coherent noise, and identify its frequency and level above the system’s noise floor. This gives the GE Field Engineer the ability to locate the source(s) and troubleshoot zipper artifacts.
Because the coherent noise source is almost always outside of the bore of the magnet, and to improve noise sensitivity, the SPT Coherent Noise test uses the head coil positioned outside the rear of the magnet bore.
The SPT Coherent Noise test is used to detect a single non-echo related frequency that is present in the scan room or leaked into the receiver. This appears as a single line (often dashed or dotted) in the image, called a “zipper.” Zippers can occur when the RF shielding to the scan room has somehow been compromised. Multiple frequencies could generate multiple zippers.
Non-echo-related frequencies are encoded during normal acquisition and reconstructed into the images along with the other echo frequencies from the object being scanned.
The SPT Coherent Noise test runs a number of no-RF scans and analyzes the resultant noise images:
-
Maximum signal dot intensity
-
Maximum zipper dot intensity
-
Average zipper intensity
Images are collected at various parameter settings:
-
R1=7 and R1=11
Typically, more data points and higher RV values are reported for R1=11. Consistent reports of more data points and higher RV values only when R1=7 may suggest an internal, systemic noise issue.
-
Matrix size: 256x256 and 512x512
-
Bandwidth: 16 kHz and 32 kHz
-
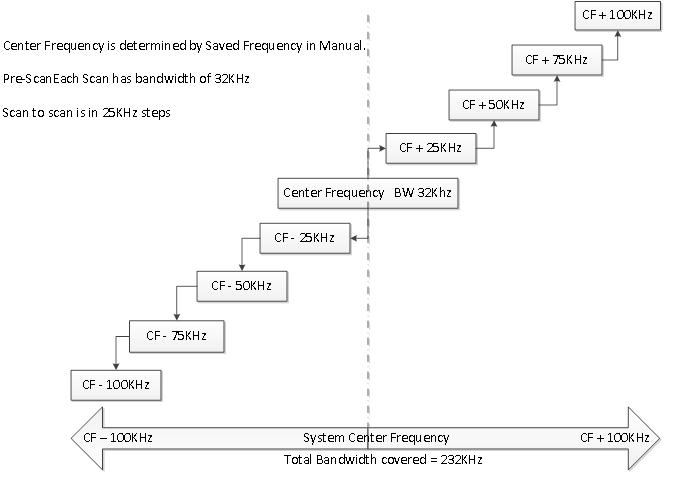
Center frequency: +/-100 kHz
Data Acquisition
Head coil positioned near the end of travel outside the rear of the magnet to permit listening for noise that may be present due to a breach in RF shielded room integrity.
Three sets of data are collected:
-
First set of 9 scans use an R1 gain value of 11. No RF, no gradients.
-
The next set of 9 scans use an R1 gain value of 7. No RF, no gradients.
-
The final 2 scans are with gradients on, no RF. These scans are not analyzed by the algorithm, but are used for visible noise in images.
Theoretical center frequency is:
-
1.5T: 63.864 MHz
-
3.0T: 127.72 MHz
Starting with HD23.0/DV24 software, the following changes were made to the acquisition:
-
Get system center frequency (CF) from the prescan log file, and compare it against theoretical center frequency.
-
Shift manual prescan center frequency by 25 kHz (if the difference is greater than 25 kHz) to minimize the difference between the actual and theoretical center frequency.
Figure 1. Data Acquisition
Starting with DV25 software, an exemption was added for 1.5T only systems (450 and 450w). Artifacts in the bandwidth 64 MHz +/- 10 KHz do not cause CNT to fail, if the frequency has the ratio of Max Pixel Values/Upper Spec Limit < 10 and the max and min failing frequencies lie within 1 KHz.
Analysis
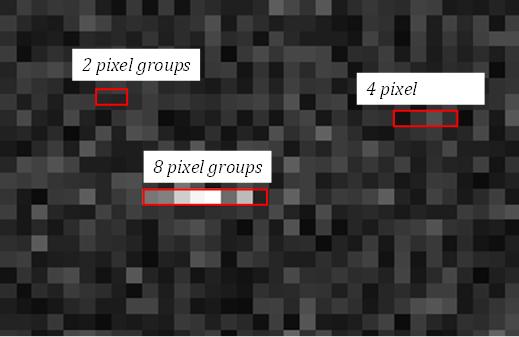
The magnitude images are analyzed for artifacts using a pixel grouping algorithm:
-
Normalize each image to a mean value of 1.00
-
Square each pixel value to increase sensitivity to low level artifacts
-
Check different width pixel groups, compare group mean to upper spec limit (USL)
-
Group by 1 pixel, 2 pixels, 4 pixels, 8, etc., up to full image width
-
Each group width has separate upper spec limit (USL)
-
Upper spec limits are based on expected mean values (the grouped pixel values have a gamma distribution) and visibility threshold
Figure 2. Pixel Algorithm for Coherent Noise Test
Result Reporting
If any failures are detected with R1=11 or R1=7, the following details are printed: Image number, row number, pixel group, artifact frequency, row max value, upper limit, (row max value/upper limit)
Starting with DV25 software, an exemption was added for 1.5T only systems (450 and 450w). Artifacts in the bandwidth 64 MHz +/- 10 KHz do not cause CNT to fail, if the frequency has the ratio of Max Pixel Values/Upper Spec Limit < 10 and the max and min failing frequencies lie within 1 KHz.
The following known 3.0T artifacts may be exempted from normal coherent noise test upper spec limits:
| Artifact Name | Artifact Frequency (MHz) |
| 128.000 | 128.000 |
| 127.5 | 2 x (CF – 127.500) + 127.500 |