
- 00000018WIA3043ED20GYZ
- id_131072264.0
- Feb 14, 2020 4:10:48 PM
1.5T GP Flex Coil SNR Test and Troubleshooting
| Required persons | Preliminary requirements | Procedure | Finalization |
|---|---|---|---|
| 1 | Not Applicable | 30 minutes | Not Applicable |
| Item | Quantity | Effectivity | Part number | Manufacturer |
|---|---|---|---|---|
| Head TLT Sphere | 1 | - |
46-265826G6 | - |
| Head Loader | 1 | - |
46-287899G1 | - |
| GP Flex Coil MR450 Adapter | 1 | - |
5176411 | - |
| Curved Adapter Panel for Flat Table (GEM) | 1 | - |
5395828 | - |
| Condition | Reference | Effectivity |
|---|---|---|
|
This coil configuration name must be installed: GE_HDx GPFLEX | - | - |
Follow this process to complete the Signal-to-Noise Ratio (SNR) test using the GP Flex Coil. This procedure is also used for troubleshooting the external cable and pin diode.
Coil Imaging Performance Verification
SNR measurements for the GP Flex Coil require a set of signal and noise scans. Refer to the Data Sheet in Table 5 to understand the data required to calculate the SNR. The image quality check uses two different protocols for signal and noise image acquisition:
-
The Signal Scan is a Fast Spin Echo (FSE) sequence used to minimize susceptibility and B0 inhomogeneity effects. The signal scan must be run prior to the noise scan since the R1, R2, and TG values from the signal scan are used for the noise scan.
-
The Noise Scan is a Gradient Echo (GRE) sequence that has a Control Variable (do_noise) to eliminate the transmit RF completely during the scan.
The following procedure is specific to the GE 1.5T Systems.
- Make sure the Quad Head Coil is removed from the cradle before performing any body or surface coil scans. Failure to do this may result in damage to the Quad Head Coil T/R network.
- Insert the curved panel assembly in the magnet end of the table
as shown below.
Figure 1. Curved Panel Assembly 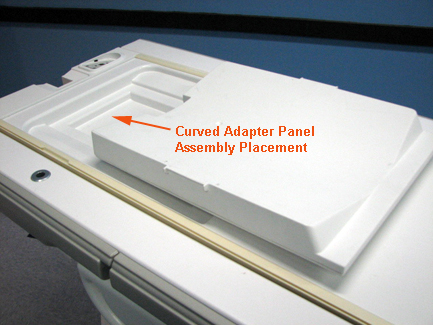
- Place the phantom with loader on the table; place the coil on top of the phantom loader, and plug the flex coil into Port A.
- At the magnet, press the Alignment Light button to turn on the light.
- Move the cradle to align the coil to the alignment light as shown.
- Press the Landmark button to landmark the alignment.
Figure 2. Landmark and Alignment 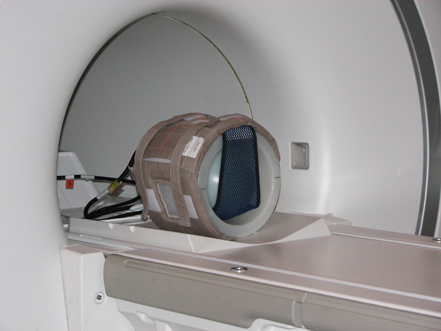
- Move the coil to the scan position by pressing the Move to Scan button; ensure the cable does not get snagged.
- At the console, set the protocols as described in the table
below.
Table 4. Signal Protocols Patient/Exam Information ID geservice Name GP Flex Coil Patient Weight 111 lbs. (50 kg) A/P Center, R/L Center 0.0 S/I Start S75 S/I End I75 # Slices 5 Table Delta 0.0 Patient Position Patient Position Supine Patient Entry Head First Coil GP Flex Series Description Signal Imaging Parameters Plane Axial Mode 2D Pulse Seq FSE-XL Imaging Options Fast PSD Name leave blank Protocol leave blank Scan Timing # TE(s) per Scan 1 TE 17 TR 500 Echo Train Length 4 Bandwidth 15.63 Acquisition Timing Freq 256 Phase 256 NEX 1 Phase FOV 1.00 Freq. DIR R/L Autoshim On Phase Correct On Auto Center Freq Peak Scanning Range FOV 24 Slice Thickness 5 Spacing 32.5 A/P Center, R/L Center 0.00 S/I Start S75 S/I End I75 # Slices 5 - Click Save RX to download the protocols, then Prepare to Scan.
- Run Auto Prescan, and record the R1,
R2, and TG values on the SNR Data Sheet below.
Table 5. SNR Data Sheet Date Comments Slice Location R1 R2 TG Signal Mean (A) Noise Standard Deviation (B) SNR (A/B) SNR Specification Limit S37.5 72.5 S0 106 I37.5 72 Date Comments Slice Location R1 R2 TG Signal Mean (A) Noise Standard Deviation (B) SNR (A/B) SNR Specification Limit S37.5 72.5 S0 106 I37.5 72 Date Comments Slice Location R1 R2 TG Signal Mean (A) Noise Standard Deviation (B) SNR (A/B) SNR Specification Limit S37.5 72.5 S0 106 I37.5 72 - Run Scan.
A signal scan must be run prior to the noise scan since the same R1, R2, and TG values must be used for both scans. Do not run an Auto Prescan prior to the noise scan as the values will change.
- Copy and paste the signal scan series: Select Signal Series, right mouse click and select Copy Series and Paste Series in the Rx Manager.
- Click View Edit and set the protocols
as described in the table below.
Table 6. Noise Protocols Patient Position Patient Position Supine Patient Entry Head First Coil GP Flex Series Description Signal Imaging Parameters Plane Axial Mode 2D Pulse Seq GRE Imaging Options None PSD Name leave blank Protocol leave blank Scan Timing # TE(s) per Scan 1 TE Min Full TR 34 Flip Angle 1 Bandwidth 15.63 Acquisition Timing Freq 256 Phase 256 NEX 1 Phase FOV 1.00 Freq. DIR R/L Autoshim On Phase Correct On Auto Center Freq Peak Scanning Range FOV 24 Slice Thickness 5 Spacing 32.5 A/P Center, R/L Center 0.00 S/I Start S75 S/I End I75 # Slices 5 Table Delta 0.00 - Click Save RX and select Prepare to Scan.
- Select the arrow next to the Scan button, select Research Options, then set rhformat and do_noise CVs to 1.
- Run Manual Prescan. Verfiy R1, R2, and TG values are the same as recorded for signal scan. Do not make any changes.
- Click Done.
- Run Scan.
SNR Image Analysis
Regions of Interest (ROIs) in both signal and noise images can be measured directly in the image browser. A circular ROI should be used for the signal and a rectangular ROI for noise measurements centered at the phantom.
- Click the Measure button, select the
circular or rectangular shape, and adjust its size and orientation
when the shape is displayed in the selected image. Mean, Standard
Deviation, and area of the ROI will display in the lower right corner
of the image.
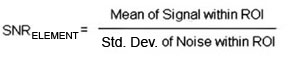 Note:
Note:The SNR calculation uses the Mean of the signal image and Standard Deviation of the noise image.
- For the signal measurement, choose an ROI covering approximately
80% of the phantom. Also measure the noise with an ROI covering 80%
of the Field of View (FOV). Examples of typical ROIs are shown below.
Figure 3. Signal and Noise Scan ROI Examples 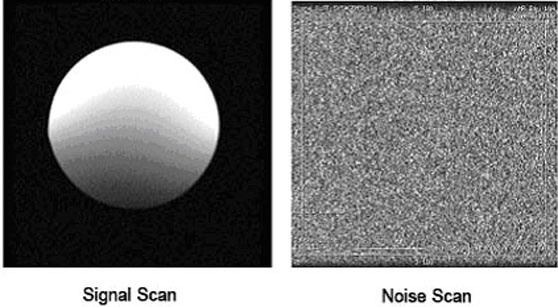
The SNR measurements must be greater than or equal to the specifications in the table below.
Images 1 and 5 are collected to verify that the phantom is correctly centered. They should be the same size.
If they are not the same size, the phantom should be repositioned relative to the coil center.
Table 7. SNR Specifications Slice Location Image Number SNR S37.5 2 72.5 S0 3 106 I37.5 4 72
External Cable and Pin Diode Check
There is only one pin diode in this antenna. This procedure indicates if the pin diode is defective and if the external cable is defective.
-
Select the Diode Test function on the Digital Multimeter (DMM).Notice - Connect the positive lead of the DMM to the center pin of the BNC on the external cable. Connect the negative lead to the main housing/ground of the BNC.
- Flex the external cable, especially near the connectors and
the strain relief. A reading of 0.400 to 0.600 should
remain on the DMM with no instability or fluctuations.
If the reading is below 0.400 in either direction, the output cable is shorted or the PIN diode is defective.
If the reading is above 0.600, the PIN diode is defective.
- Connect the positive lead of the DMM to the main housing/ground
of the BNC on the external cable, and connect the negative lead to
the center pin of the BNC as shown below.
Figure 4. BNC Connector 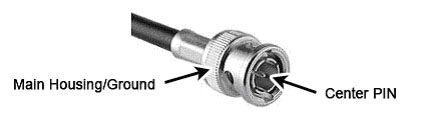
- Flex the external cable, especially near the connectors and
the strain relief. A reading of INFINITY should
remain on the DMM with no instability or fluctuations.
If the reading is INFINITY in both directions, the output cable is open or the pin diode is open.
If the cable fails any of the above tests, refer to Flex Coil Replacements to replace the cable.
Finalization
Use Table 5 to record the calculated signal to noise ratio (SNR) data obtained from the Functional Checks.