• SIGNA™ Hero 3.0T Service Methods
  • 5852800-8EN Revision 1.0
  • Object ID: 00000018WIA30BF3E20GYZ
  • Topic ID: id_13106587 Version: 3.3
  • Date: Aug 26, 2020 1:22:03 PM

RFA loopback test

Prerequisites

Table 1. Personnel requirements
Required personsPreliminary requirementsProcedureFinalization
1 -20 to 60 minutes10 minutes
Table 2. Tools and test equipment
ItemQuantityEffectivityPart numberManufacturer
RF cables kit 1---
Oscilloscope1---
Standard tool kit1---
RF power measurement kit1-

One of the following: 5307511-2, 5307511-3, or 5434817

-
Universal SST kit (1.5T and 3.0T)1-

5110731-4

-
Head coil1-

5180918

-
6 feet of N-male to N-male RG214 cable (from 1.5T tool kit, 46-317724G1 or 46-317724G2)1-

46-317724P9

-
70 dB, with 10 dB step, attenuator (from 3.0T grafidy kit, 2386042)1-

46-255838P2

-
BNC M-F feedthrough with DC blocking cap (from DVMR service cables kit, 5306523)1-

5160682

-
Body sphere (27 cm)1-

2359877

-
Body loader1-

2360037

-
Head sphere (17 cm)1-

2360025

-
Head loader1-

2360031

-
Head loader positioner1-

5110241

-
Loop Velcro squares (for attaching the RF sense loops; from universal SST kit, 5110731)as needed-

46-307152P1

-
Table 3. Safety

About this task

The RFA (radio frequency analysis) tool is designed to quantitatively measure the performance of the transmit chain by allowing loopback tests from several different points along the chain. At most points, the inter-pulse RF stability and inter-pulse RF fidelity (magnitude and phase linearity) can be measured.

For information about the theory behind the tests, see RF Loopback Test Theory.

Topic ID: id_SL1801049-1051111

Set up test

Procedure

  1. Ensure that the system is idle, and remove all portable coils from the bore.
  2. On the driver module in the PEN cabinet, set switch 2 (SW2) to TR DISABLE.
    Figure 1. Setting TR disable
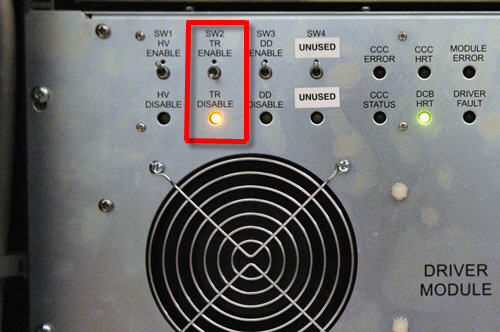
  3. On the exciter/ref clock module located in the PEN cabinet, set the RF Enb switch down (Disable).
    Figure 2. Exciter/Ref Clock Module
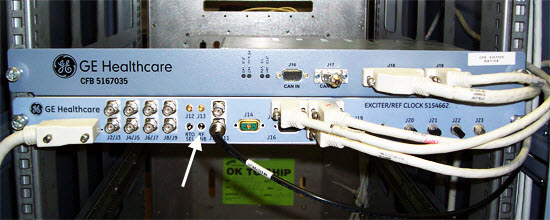
  4. The following table provides links to the setup diagrams for the loopback test for the various components. Locate the setup diagram that matches the system and the loopback test that you want to perform. At a minimum, run the Headdummy or Bodydummy loopback and Exciter loopback tests. Set up the components to match the setup diagram.
Topic ID: id_SL1801058-1051111

Perform test

Topic ID: id_SL5399574-1051111

Running RFA in exciter, bodydummy, or headdummy mode

Procedure

  1. Set the 1 dB/step and 10 dB/step rotary attenuators to the settings shown in the appropriate setup diagram.
  2. Enable RF output from the exciter module:
  3. Landmark as indicated in the setup diagram for the test you are running, and advance to scan.
  4. In the service browser, select Image Quality > RFA Tool. The RF Analysis Tool appears.
  5. Select the Loopback Mode for the test you want to run.
  6. Select RF Pulse Type (initially use the default Standard, and select Exp (Ascending) and Exp (Descending) in the second and third iterations of the test).
  7. Select Gradient State (use the default XYZ On).
  8. Click Start.
  9. Note: SVAT errors usually indicate a setup problem such as landmark, 32-channel patient table connector not connected, TR or DD fault, etc. Check the error log.
    A popup window asks you to check the loopback setup. Check the setup, and then click Continue.
  10. After about 60 seconds, a Set loopback signal level message box appears. When this message appears, click the Patient icon.
    Figure 3. Patient icon
  11. Slowly increase TG to 200 while adjusting the rotary attenuators (to prevent receiver over-range indicated by R1%>100 or R2%>100) until you achieve an R1% and R2% display on the manual prescan page of 84-94% with TG=200.
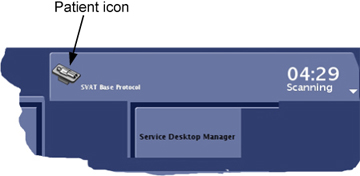
  12. When done, select the Toolbelt icon to return to the service window. Start a scan by clicking Proceed & auto-scan on the Set loopback signal level message box.
    Figure 4. Message box
  13. After the scan and analysis ends, view the results. Compare the results to the typical normal plots shown in RFA plot results. Real failures will exceed the example plot values by 2 or more times. Minor differences are not failures. Select the popup choice to erase the displays. The plots are saved as JPG files under /usr/g/service/cclass/RFA/.
Topic ID: id_SL5399576-1051111

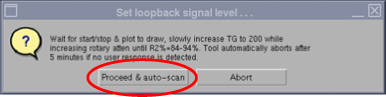
Running RFA in headsense or bodysense modes

Procedure

  1. Set the 1 dB/step and 10 dB/step rotary attenuators to the settings shown in the appropriate setup diagram.
  2. Set up the oscilloscope as described in the setup diagram.
  3. Enable RF output from the exciter module.
  4. On the driver module in the PEN cabinet, set switch 2 (SW2) to TR ENABLE.
  5. Landmark as indicated in the setup diagram for the test you are running, and advance to scan.
  6. In the service browser, select Image Quality > RFA Tool. The RF Analysis Tool appears.
  7. Select the Loopback Mode (Head or Body) for the test you want to run.
  8. Select RF Pulse Type (initially use the default Standard).
  9. Select Gradient State (use the default XYZ On).
  10. Click Start.
    Note: Do not click OK on the sense loop popup until you are ready to end the test.
  11. Note: SVAT errors usually indicate a setup problem such as landmark, 32-channel patient table connector not connected, TR or DD fault, etc. Check the error log.
    Set up the oscilloscope according to the following parameters:
    For this setting: Select:
    Channel 1Ground1 MegaOhm
    Vertical scale100 mV/division
    Vertical position0 V
    InvertOff
    BandwidthFull
    Channel 2Ground1 MegaOhm
    Vertical scale100 mV/division
    Vertical position0 V
    InvertOff
    BandwidthFull
    TriggerTypeEdge
    Trigger sourceExternal
    CouplingDC
    SlopeA trigger slope
    LevelA trigger level
    Trigger level300 mV
    Horizontal position0%
    Horizontal scale800 µs/div
    ScalingScale the amplitude of the envelope pulse so it is coincident with the envelope of the RF pulse.
  12. A popup window asks you to check the loopback setup. Check the setup, and then click Continue.
  13. After about 60 seconds, a Set loopback signal level message box appears. When this message appears, click the Patient icon.
    Figure 5. Patient Icon
  14. Increase TG to 200.
  15. This is a visual test only. When properly scaled, the two waveforms should be similar and it should be possible to overlay one over the other. Investigate any differences in wave shape between the two waveforms.
Topic ID: id_SL2100728-1051111

RFA plot results

Topic ID: id_SL2100729-1051111

Inter-pulse stability plots

About this task

The following sample plot results are Inter-pulse Stability (created in Standard Test mode only)

Procedure

  1. Integ
    The resulting plot should look similar in magnitude and shape to that shown in Figure 6, Figure 7, and Figure 8.

    This is analogous to the earlier PkMag plot description; however, this plot represents the RF pulse INTEGRAL (or area) for each RF pulse acquired.

    Figure 6. Integ, or integral (exciter)
    Figure 7. Integ (bodydummy)
    Figure 8. Integ (headdummy)
  2. 0-order Phase
    The resulting plot should look similar in magnitude and shape to that shown in Figure 9, Figure 10, and Figure 11.

    This is analogous to the earlier PkMag plot description; however, this plot represents the RF pulse 0-order phase (AVERAGE PHASE) in degrees for each RF pulse acquired.

    Figure 9. 0-order phase (exciter)
    Figure 10. 0-order Phase (bodydummy)
    Figure 11. 0-order phase (headdummy)
  3. 1-order Phase
    The resulting plot should look similar in magnitude and shape to that shown in Figure 12, Figure 13, and Figure 14.

    This is analogous to the earlier PkMag plot description; however, this plot represents the RF pulse 1-order phase (LINEAR PHASE) in degrees/point for each RF pulse acquired.

    Figure 12. 1-order pulse (exciter)
    Figure 13. 1-order pulse (bodydummy)
    Figure 14. 1-order pulse (headdummy)
Topic ID: id_SL2100738-1051111

Intra-pulse fidelity plots

About this task

The following sample plot results are Intra-pulse Fidelity (created in Exp(onential) Test mode).

Procedure

  1. Magfit
    The resulting plot should look similar in magnitude and shape to that shown in Figure 15.

    Plot title: none; mag & fit vs sample index; Ideal: Perfect exponential of blue points with overlaid red exponential curve fit.

    Plot title: none; mag err(%) vs sample index; Ideal: Flat horizontal blue line of processed points with overlaid flat red curve fit, both at mag err(%) = 0.0 %.

    Plot title: none; mag err(dB) vs sample index; Ideal: Flat horizontal blue line of processed points with overlaid flat red curve fit, both at mag err(dB) = 0.0 dB.

    Figure 15. Magfit, or intra-pulse (All)
  2. Magdif

    The resulting plot should look similar in magnitude and shape to that shown in Figure 16.

    Plot title: Mag linearity err(%) ; mag err(%) vs dB; Ideal: Flat horizontal blue line of processed points with overlaid flat red curve fit, both at mag err(%) = 0.0 deg.

    Plot title: Mag linearity err(dB); mag err(db) vs dB; Ideal: Flat horizontal blue line of processed points with overlaid flat red curve fit, both at mag err(dB) = 0.0 dB.

    Plot title: Mag linearity err DIF(dB/dB); mag err DIF(dB/dB) vs dB; Ideal: Flat horizontal blue line of processed points with at mag err(dB) = 0.0 dB.

    Figure 16. Magdif (All)
  3. Phafit
    The resulting plot should look similar in magnitude and shape to that shown in Figure 17.

    Plot title: none; Phase(deg) vs sample index;Ideal: One horizontal red line at any phase(deg) value.

    Plot title: none; Phase(deg,blue) vs sample index; Ideal: One horizontal red line at same phase(deg) value as previous ideal plot.

    Plot title: none; Phase err(deg,blue) & fit(red) vs sample index; Ideal: One horizontal red line at 0.0.

    Figure 17. Phafit (All)
  4. Phadif
    The resulting plot should look similar in magnitude and shape to that shown in Figure 18.

    Plot title: Phase linearity err(deg); Phase err(deg) vs dB; Ideal: One horizontal red line at 0.0

    Plot title: Phase linearity err DIF(deg/dB); Phase err DIF(deg/dB) vs d; Ideal: One horizontal red line at 0.0

    Figure 18. Phadif (All)
Topic ID: id_14998647

Finalization

Procedure

  1. On the exciter/ref clock module, set the RF Enb switch to Disable (down).
  2. When finished with the loopback test, restore the cabling to the default clinical state.
  3. On the exciter/ref clock module, set the RF Enb switch to Enable (up).
  4. On the driver module in the RF system cabinet, switch the TR drive switch (SW2) to TR ENABLE.
  5. Perform a check scan to verify the system is operating properly.