
- SIGNA™ Hero 3.0T Service Methods
- 5852800-8EN Revision 1.0
- 00000018WIA30AAB230GYZ
- id_156668061.4
- Dec 12, 2019 5:30:57 PM
EPI White Pixel Test - Full Mode
Prerequisites
| Required persons | Preliminary requirements | Procedure | Finalization |
|---|---|---|---|
| 1 | - | 45 minutes | - |
| Condition | Reference | Effectivity |
|---|---|---|
|
Service key installed | - | - |
| - | - |
About this task
This procedure uses echo planar image (EPI) scans and the raw data mode of recon to analyze the raw data for white pixel artifacts. These raw data artifacts can exhibit themselves as corduroy artifacts in images. There are two modes of operation for the EPI White Pixel Test.
-
Mode 1 creates 48 images while iterating on Readout Axis (X, Y, Z), (readout gradient fundamentals frequency), and placement of the data acquisition window over the attack "knee" and decay "knee" of the readout trains positive and negative lobes. In addition, Mode 1 generates various report fields and plot files that can be used to analyze white pixels. Mode 1 has been incorporated in the echo planar test (EPT) test to be run as a single test.
-
Mode 2 prompts you to enter an image number that generated the most white pixels from the Mode 1 test, and allows you to use the real-time display feature of EPI to loop on that condition for troubleshooting purposes.
Procedure
- Move the Cradle 320mm from Home Position and Landmark. Then, advance to scan.
Figure 1. EPI WP Setup 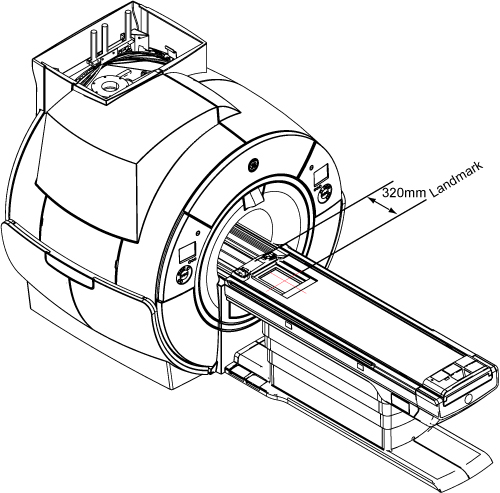
- A screen called GE Healthcare - Spike Noise Tool appears. Follow Figure 2 to set the following variables:
-
Select VRMW and Disable UTNS
-
For Options, select both Baseline Noise Test and Raw Data Analysis
Figure 2. EPI White Pixel User Interface 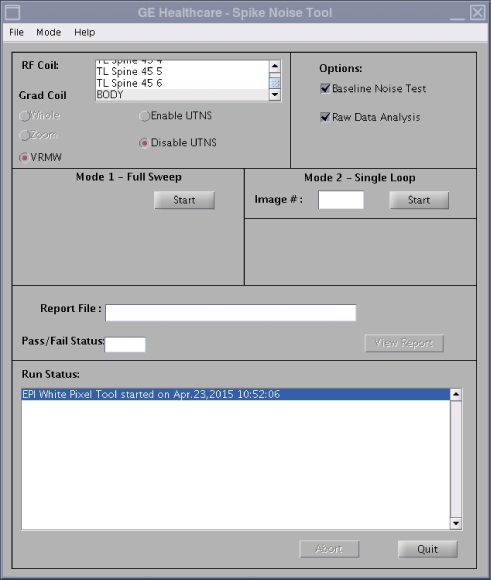
-
- Click Start for the Mode 1 - Full Sweep test. The test runs with a Run Status displaying at the bottom.
When the test is finished, the Pass/Fail Status displays PASS or FAIL.
Figure 3. Test Finished 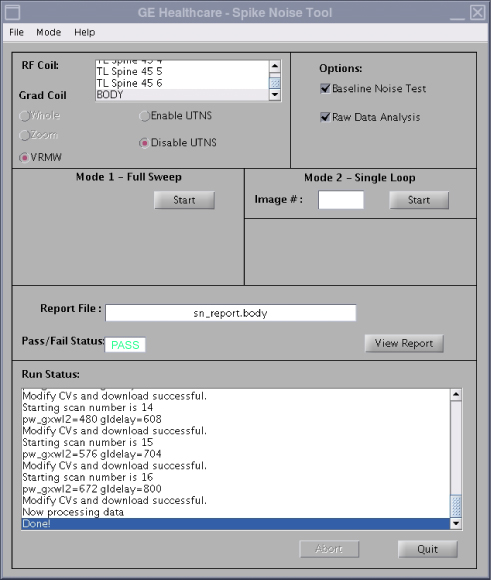
- When prompted for the image number, enter the image number (1-48) determined from the Mode 1 - Full Sweep test.
A Mode 2 Scan prompt appears.
Figure 4. Mode 2 Scan 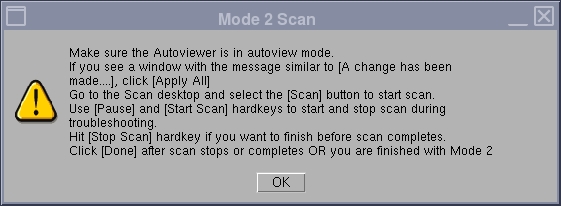
-
Table 3 indicates how the logical to physical gradients are played out in Mode 1 operation. It also indicates which images from Mode 1 are using what scan plane. This is useful information to know when using this tool in Mode 1 or in Mode 2. Typically the frequency encode axis is the one that generates the spike noise because that is the axis that has the high amplitude, high duty cycle Echo Planar Image (EPI) readout train. This is not always the case though as we have seen the phase encode axis cause problems in defective gradient filter boxes. If the White Pixel images are displayed in a 3x3, 3x4, or 3x5 format, Axis Specific Gradient Information or scan plane is displayed per column.Note: If a specific column has high white pixel values, the problem may be related to a specific gradient.
Table 3. Logical to Physical Gradients in Mode 1 Body Image Displayed Image Plane Logical Frequency Axis Logical Phase Axis Logical Slice Axis Time Order of Acquisition 1, 4, 7, 10, 13, 16, 19, 22, 25, 28, 31, 34, 37, 40, 43, 46 Axial Phys X Phys Y Phys Z 1 2, 5, 8, 11, 14, 17, 20, 23, 26, 29, 32, 35, 38, 41, 44, 47 Sagittal Phys Y Phys Z Phys X 3 3, 6, 9, 12, 15, 18, 21, 24, 27, 30, 33, 36, 39, 42, 45, 48 Coronal Phys Z Phys X Phys Y 2 Figure 5. Gradient Information 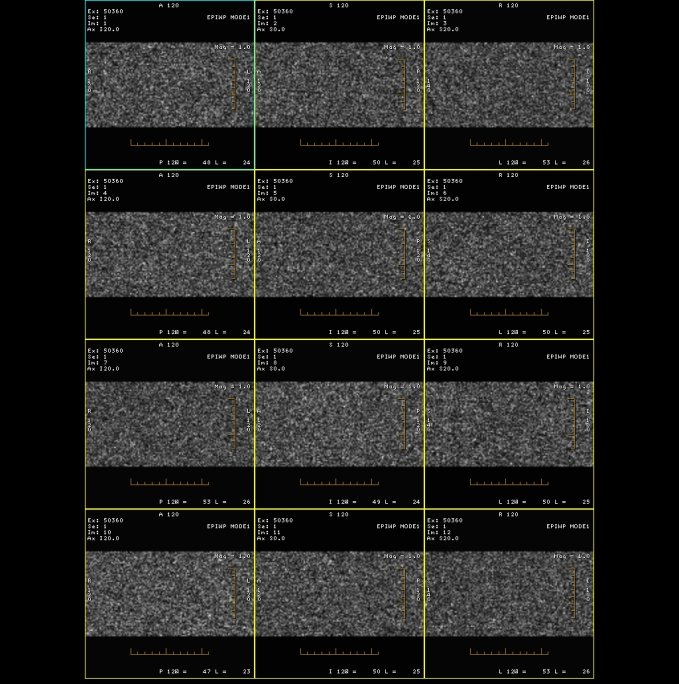
Finalization
- Select File Quit.
- Perform a Check Scan to verify proper operation.
- Turn the system over to the customer.