
- Discovery MR750 3.0T System Service Methods
- 5690009-2EN Revision 4
- 00000018WIA30E1DE20GYZ
- id_131070042.0
- Feb 22, 2021 1:47:09 AM
Multi-Coil Quality Assurance Tool
Prerequisites
| Required persons | Preliminary requirements | Procedure | Finalization |
|---|---|---|---|
| 1 | Not Applicable | 20 minutes per coil minutes | Not Applicable |
| Item | Quantity | Effectivity | Part number | Manufacturer |
|---|---|---|---|---|
| Coils and Phantoms for all coils to be tested are required. | - | - | - | - |
| Body System Gain tool | - | - | - | - |
| Isocalibration | - | - | - | - |
About this task
The Multi-Coil Quality Assurance (MCQA) Tool simplifies data acquisition and analysis of SNR for surface coils. It helps detect dead coil elements as well as develop improved ISNR specifications for all Multi-coils, independent of scanner instabilities. The tool does not rely on ROI placement as other SNR tools have in the past. Instead, it chooses slice locations based on coil geometry, acquires one Spin Echo Image, and turns off RF to gather a noise image. The noise mean of the 2D-noise-only image is subtracted from the 2D intermediate image.
The summed signal (2D intermediate image – noise mean) is calculated, and then the signal is divided by the Standard Deviation of the Noise of all pixels of the noise-only-image to give the ISNR. See the formulas below.
Setting Up and Starting the Multi-Coil QA Tool
Procedure
- On the Common Service Desktop (CSD), click Image
Quality, then click Multi-Coil QA Tool, and then click Click here to start this tool. The Coil Log Viewer appears.
Figure 2. Multi-Coil QA Tool Example 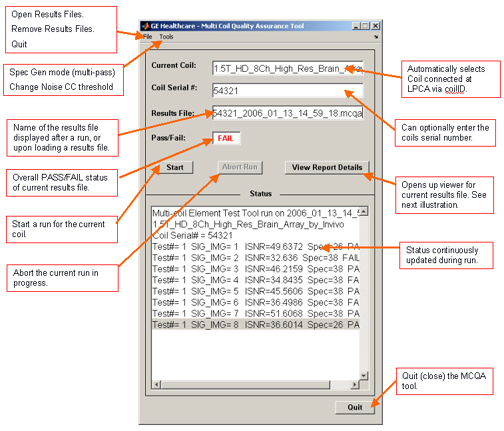 Note:
Note:If possible, run the Coil Datapath Diagnostic tool before the MCQA to validate the receive chain functionality. If the MCRV tool has missing or failed results, the MCQA tool detects it. If popup appears either select Yes to proceed anyway with scan or No to end MCQA and exit to run Coil Datapath Diagnostic.
- In the MCQA Tool window, press the Start button to begin the test. A warning dialog queries the user to
verify the coil/phantom setup and position. Select Yes to continue.
- A progress indicator displays approximate total test time, elapsed
time and percentage complete, as shown in Illustration 3.
Figure 3. Status and Time Bar 
- A progress indicator displays approximate total test time, elapsed
time and percentage complete, as shown in Illustration 3.
Viewing Report Results
Procedure
- After running the Multi-Coil QA test, select View
Report Details to see the results. To review past results,
select File, Open Results File and then select the desired coil results file. The Results Viewer
opens as shown in Illustration 4. The Results file name and Pass/Fail
Results are listed across the top of the viewer.
Figure 4. Results Viewer Example 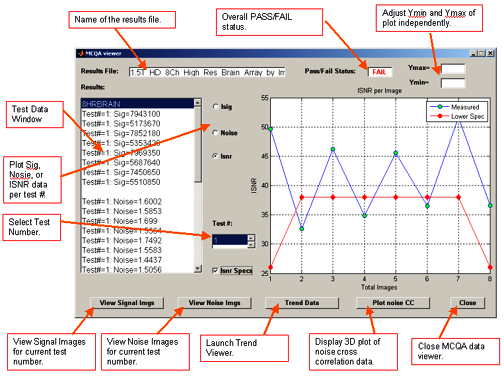
- To view all the Signal or Noise Images, select View
Signal Imgs or View Noise Imgs respectively,
and an image viewer will appear with one image per coil element, ordered
left–to-right and top-to-bottom. See Illustration 5.
Figure 5. Signal and Noise Images 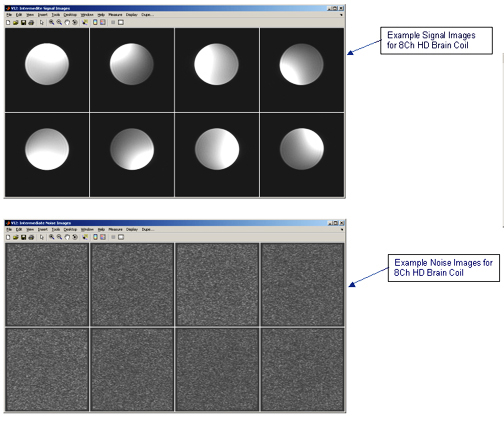
- From the MCQA Viewer, select the Plot noise CC to display a
3D plot of the noise correlation data for the results being viewed.
The data shows the relative cross correlation of noise between receiver
channels. Green data is a one-to-one correlation. Red data are correlations
above the threshold.
Figure 6. Signal and Noise Images 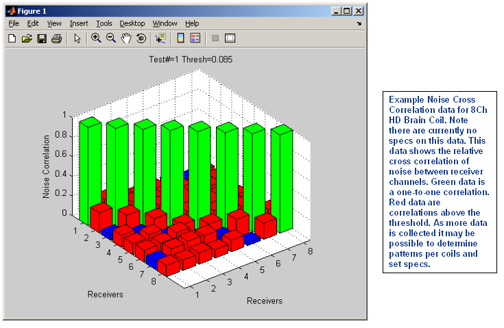 Note:
Note:There are currently no spec for the cross correlation data. It may be possible to determine patterns per coil and set specs as more data is collected.
- Past Multi-Coil QA results are stored on the system that allow
for the ISNR data to be trended over time. On the Multi-Coil
QA Results Viewer window, select the Trend
Data button, and the MCQA Trend Viewer displays as shown
in Illustration 7.
Figure 7. MCQA Trend Viewer 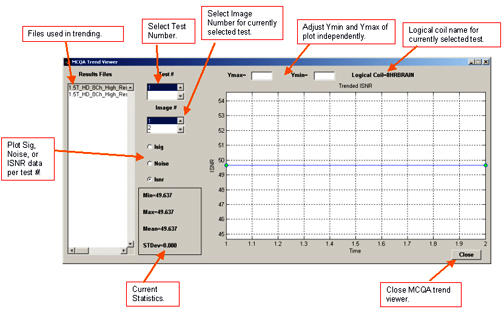
MCQA Trend Viewer
About this task
Every time the MCQA test finishes, a new Results file is generated. These results can be graphically trended within the MCQA Trend Viewer. All the Results Files available for trending are listed in the window to the left of the screen.
Procedure
- Select the Test and Image numbers of the data you would like to review from the middle scroll boxes.
- Choose the Isig, Noise, or Isnr radio button that corresponds with the desired graph.
- The data will be displayed over time (# of tests run). To change the vertical scale, enter new values into the Ymax and Ymin boxes at the top of the screen.
- Statistics pertaining to the existing data will be given in the box in the lower center section of the GUI.
Finalization
Procedure
- To exit the MCQA Trend Viewer and Results Viewer, select the Close button.
- Close all image files.
- Remove all coils and phantoms from the system bore.