System Level Correlated Noise Check
Prerequisites
Correlated noise is phase and frequency coherent noise sources that correlate to clocks and other digital signals which are generated internal to the magnetic resonance imaging (MRI) system. These noise sources cause undesirable constant frequency lines (noise "zippers"), or bright spot ("hot" pixel cluster) type artifact in MR images. These problems are usually caused by poor screen room integrity or grounding problems. To check the correlated noise, perform the following tests:
-
Place the Head Coil on the table and landmark as usual.
-
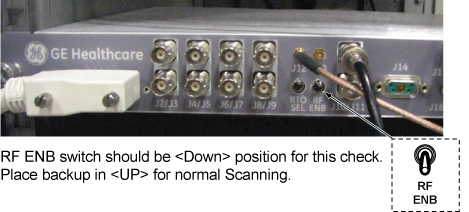
Place the RF ENABLE switch on the front of the Exciter module in the Disable (down) position to disable transmit radio frequency (RF) output.
-
Take nine scans with R1=11, 256matrix.
-
Take nine more scans with R1=7.
note:The scan range for this 1.5T system is between 63,764,000 and 63,964,000 Hz.
-
Take one scan at the magnet frequency with the R1=11, 512 matrix. Then, take one more scan at the magnet frequency with the R1=7, 512 matrix.
-
Analyze all images for artifacts.
1 Scan Preparation
Procedure
- Remove the left front cover from system cabinet.
- Disable RF output by placing the RF ENABLE switch on the front of the Exciter module in the Disable (down)
position. See Figure 1.
Figure 1. RF OUT - Disable/Enable Switch
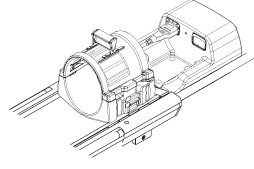
- Place the head coil on the cradle.
Figure 2. Head Coil Setup
- Landmark on the center of Head Coil. Then, press [Advance to Scan].
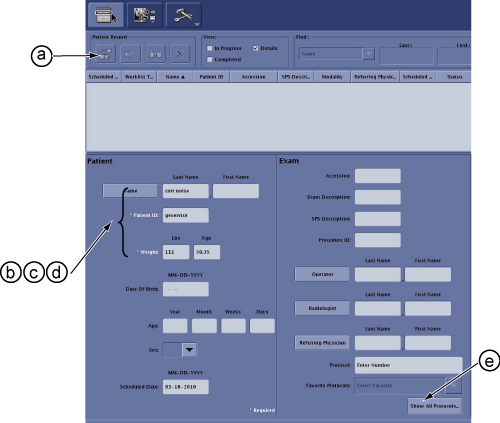
- At the operator work space, prepare the system for a Correlated
Noise (256 matrix) scan:
- Click New Patient Icon.
- Name: corr noise.
- Id: geservice.
- Weight (Lb): 111.
- Click Show All Protocols .
Figure 3. Protocol setup 1
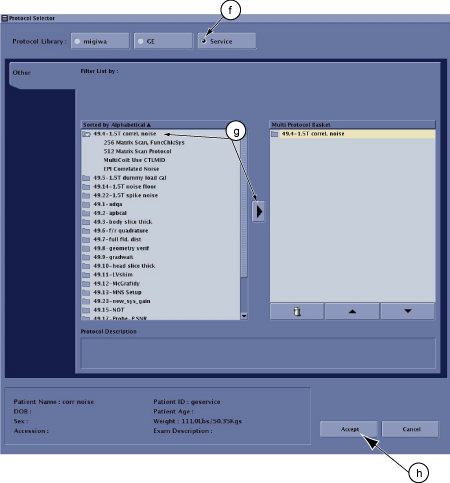
- Select Service.
- Select 49.4-1.5T correl.noise and move it right field (Multi Protocol Basket).
- Select Accept.
Figure 4. Protocol setup 2
- Select the [Start Exam].
- Select Save Rx.
Figure 5. Protocol setup 3
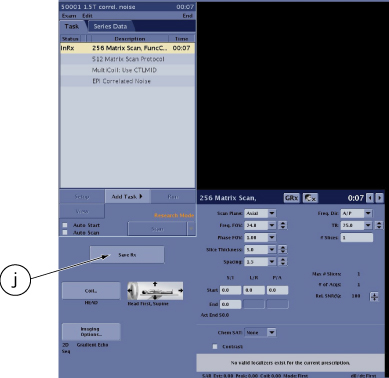
- Click on the arrow next to the SCAN button then select Research, click Setup Param, enter
settings: R1 =11, R2 =15, TG =0, and click Done.
Figure 6. Protocol setup 4
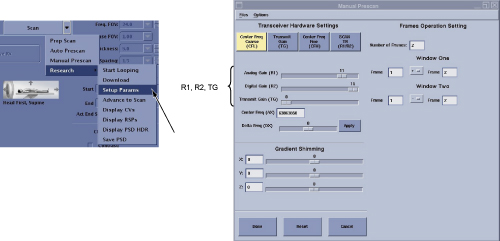
- Click on the arrow next to the SCAN button then select Manual Prescan.
- Record the current system frequency, and set the system frequency
as 63764000 for 1.5T systems.
Figure 7. Manual Prescan
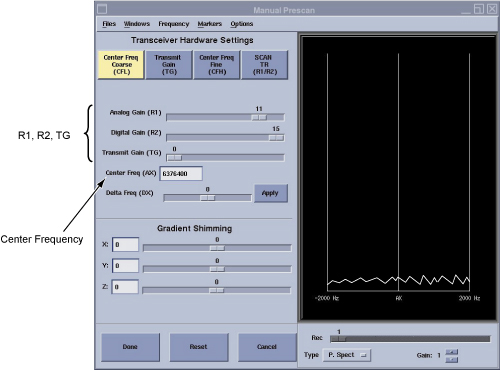
- Click Done.
- Click Scan.
- After the scan is complete, click Manual Prescan and increment the system frequency by +25,000 Hz using AX.note:
The DX parameter is limited to delta frequency changes of 200 Hz at a time. Therefore, use the AX command to change the value by +25,000 Hz for each new frequency thereafter.
- Click Done then Scan. Repeat this step eight times. Increment the system frequency by +25,000 Hz each time.
Refer to the Data Sheet 3281278.pdf, Correlated Noise Scan Data.
- Click on the arrow next to the SCAN button then select Research, click Setup Param, and set R1 = 7. Click on [Done],
- Click Manual Prescan, then set the system frequency back to 63764000 for 1.5T systems.
- Click Done then Scan.
- After the scan is complete, click Manual Prescan and increment the system frequency by +25,000 Hz. Click Done, then Scan. Repeat this step
eight times while incrementing the system frequency by +25,000 Hz
each time (all at R1 = 7).
After completing the ninth scan, proceed to the next step.
- At the operator workspace, prepare the system for a Correlated
Noise (512 matrix) scan.
- Double click '512 matrix Scan Protocol' from Task to activate.
- Select Save Rx.
- Click on the arrow next to the SCAN button then select Research, click Download.
- Click on the arrow next to the SCAN button then select Research, click Setup Param, enter settings: R1 =11, R2 =15, TG =0, and click Done.
- Click on the arrow next to the SCAN button then select Manual Prescan.
- Set system frequency to magnet frequency (recorded in ). Select [Done]
- Click [Scan].
- After the scan is complete, Click on the arrow next to the SCAN button then select Research, click Setup Param, and set R1 = 7. Click on [Done], then [Scan]. After this second scan at magnet frequency is completed, continue to Step 1.
2 Correlated Noise Data Analysis
Images must be viewed in an unmagnified format.
Procedure
- Background Mean and Standard Deviation. Using the Image Browser,
measure and record the Mean and Standard Deviation for the first R1=11
image and the first R1=7 image of each image set (both 256 matrix
and 512 matrix scans), per the following steps. If you wish, record
Mean and Standard Deviation values for the other images.
- Position a circular cursor from [Measure] so that it is in the
center of the image area. Using the size/shape handle, set the circular
size for an area of approximately 1200 mm2 (see Figure 8).
Figure 8. Correlated Noise Image
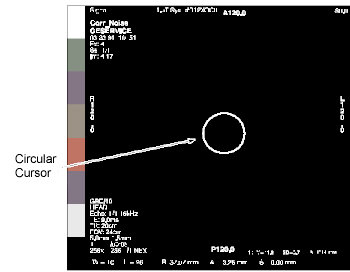
- Ensure that zipper and/or bright pixels do not fall within the circle.
- Record the mean value
 and standard deviation value (SD) displayed on screen in Data Sheet. 3281278.pdf
 - Calculate pixel acceptance guidance value: (Pi) limit = + 8 (SD), for first R1=11 and R1=7 256 matrix scans, and for both 512 matrix scans. Record
these four values in the Acceptance Guidelines - Pixels (Pi) column
in the data sheet.3281278.pdf
- Position a circular cursor from [Measure] so that it is in the
center of the image area. Using the size/shape handle, set the circular
size for an area of approximately 1200 mm2 (see Figure 8).
- Review all images for any bright spots. View all 20 images.
- Adjust window width to 1 and level to pixel acceptance guidance value recorded in data sheet from Step 1.
- The image will be flat black; any "hot" pixel clusters will
appear white. If the bright spot is a single pixel (temporarily increase
the window level a bit to determine this), then it's a random noise
value, which can be ignored. If, however, the bright spot is part
of a "hot" pixel cluster, then:
-
First scan "hot" pixels: Make sure that all system cabinet circuit boards are properly seated, and that all circuit board mounting screws are securely tightened (to assure proper grounding), then rerun all scans and repeat analysis steps Step 1 and Step 2.
-
Second scan "hot" pixels: Set window width to 1, and increase window level until brightest pixel (Pi), in cluster of interest goes black. Record the window level value (Pi) and the pixel location (L, P) in the appropriate data sheet. Repeat the "hot" pixel check/recording for all images.
-
- Review all images for zippers. View all 20 images on the screen.
Adjust window level so that any zippers are displayed, but normal
noise is not displayed (start at a level setting of 60). Review all
images for zippers. If any are detected:
-
First scan the zippers: Be sure that all system cabinet circuit boards are properly seated and that all circuit board mounting screws are securely tightened (to assure proper grounding), then rerun all scans.
-
Second scan zippers: If the zippers still exist, continue with Step 4.
-
- Zipper Peak Pixel (Perform if zipper is present in image.)
- Set window width to 1.
- Increase window level until brightest pixel (PZ), in zipper of interest goes black. Record window level value (PZ) in Data Sheet.
- Calculate using measured and (SD) data from appropriate data sheet: + 6 (SD). Record result in appropriate data sheet, Acceptance Guidelines,
PZ column. Check that measured Zipper Peak
Pixel (PZ) is less than or equal to the calculated
guideline.
- Calculate using the measured and (SD) data from the appropriate data sheet:
- 6 (SD). Record the result in the
appropriate data sheet, Acceptance Guidelines, PZ column. Verify that the measured Zipper Peak Pixel (PZ) is greater than or equal to the calculated guideline.
- Zipper Mean (Perform if the “zipper” is present
in the image.)
- Position a rectangular box from Measure so that it covers only the area (and not beyond) of a zipper (or section of a segmented zipper).
- Record the mean value (Z) of the zipper in the data sheet.
- Calculate using the measured data from the appropriate data sheet: + 3. Record in the data sheet 3281278.pdfAcceptance Guidelines, Z column.
Verify that Zipper Mean ( Z) is less than the calculated guideline.
note:If the results of the data for "hot" pixels and zippers do not meet the Acceptance Guidelines in the Data Sheet, use the appropriate procedures to troubleshoot the system.