Surface Coils SNR Test
Prerequisites
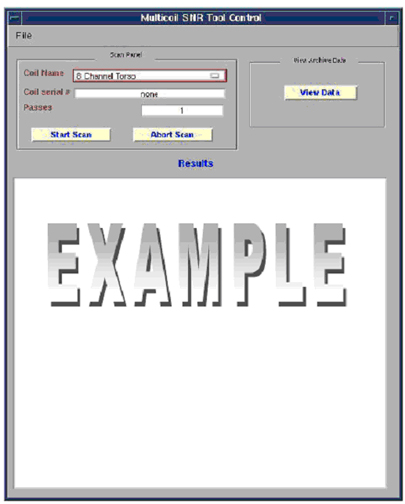
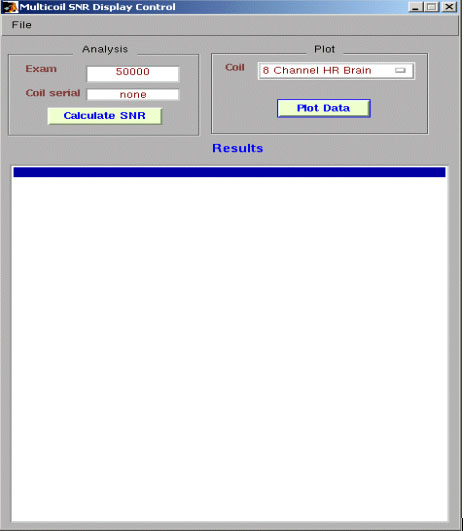
This procedure is used for several coils. Open the Coil SNR tool as shown in Figure 1, click on the square tab on the right side of the Coil selection to determine which coils are available to use with this tool.
Procedure
- Go to the Common Service Desktop -> Image Quality and select Coil SNR Test.
- Select Click here to start this tool.
- Select method for calculating SNR.
- Use the specific Coil Service manual to set up the coil and phantom for Landmark and Instructions. If the coil service manual also provides an SNR procedure, then follow that procedure. Otherwise continue with the following steps.
- Select file -> Help then access the proper coil.
- Select the coil type you want to run, then select Start Scan. See Figure 1. This illustration shows an example using the 8 channel Torso coil.
Figure 1. Coil SNR tool
- After the test is complete, the tool will automatically extract and analyze the images
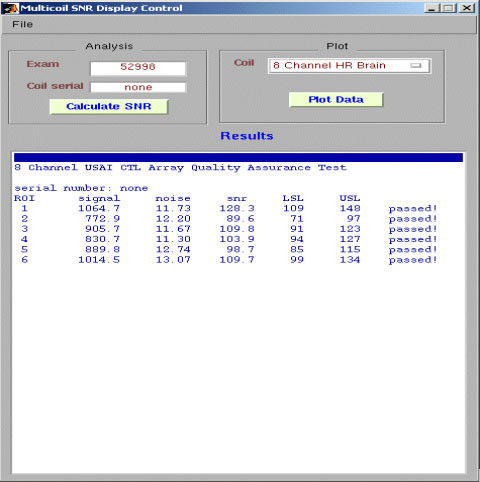
- When the scan completes, the SNR data will be displayed in the
Multicoil SNR Tool Control window. Each ROI returns an individual
result with a pass or fail indication. See Figure 2. The results are automatically recorded as files in /usr/g/service/data. Please refer to this directory for a history of functional tests
performed on a specific system. The individual receiver images and
composite image are saved in the system. The signals used to calculate
SNR are taken from the composite image. Signal images are acquired
using a SE sequence with CV saveinter set to 1 to save intermediate
images into the image database.
Figure 2. SNR Results
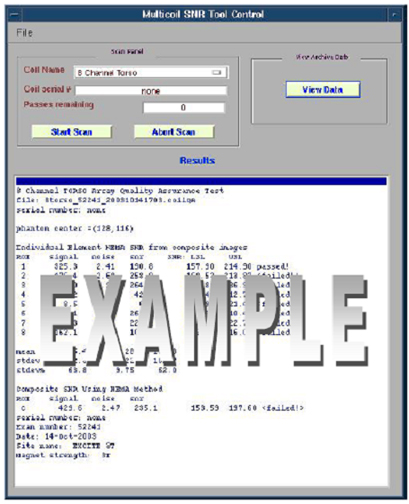
Figure 3. Example Individual Receiver Images And Composite Image For CTL Coil
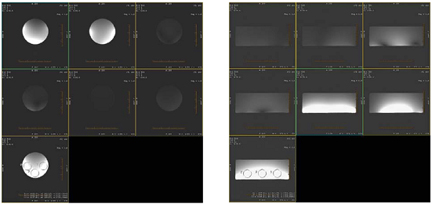
- After reviewing the tabular SNR data, examine the stored individual element images visually to ensure that the elements are functioning properly. This gives added insurance that all elements are functioning normally. (It is possible that the composite SNR test can show a passing result even though an element can be faulty).
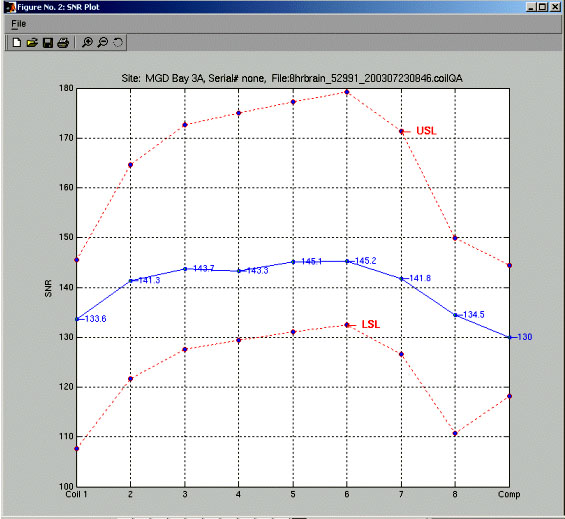
- For most coils, a plot of the results will appear in a separate
window. This also will display automatically. The Upper Spec and Lower
Spec lines appear in red with the current test results shown in blue.
See Figure 4.note:
The USLUpper Spec Limit can be ignored. This limit will be removed in future versions of EXCITE software.
Figure 4. SNR Plot
- Optionally:
- To view the most recent plot data again or previous results,
click on view data. The following GUI will appear. See Figure 5
Figure 5. View Data
-
- To view the most recent plot data again or previous results,
click on view data. The following GUI will appear. See Figure 5
- From this menu, select plot data and view SNR data from previous runs.
- Select the run number from Data Plot Control GUI.
- Click on Plot Data to get a graphic representation of the coil SNR. See Figure 6.
- To recalculate the most recent exam SNR results, enter the correct
exam numer in the Exam Field under the Mulitcoil SNR display control
GUI, then click the Calculate SNR button.
SeeFigure 6 and Figure 7.
Figure 6. SNR plot data
Figure 7. SNR value data
Finalization
No finalization steps.