HD T/R Quad Extremity Coil SNR Test
Prerequisites
Follow this process to prepare for the SNR test using the HD T/R Quad Extremity Coil by Invivo. The SNR test process is the same (For 1.5T catalog, M3335ME) .
1 Phantom Setup
Procedure
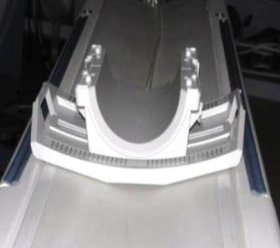
- Place the baseplate of the coil on the patient table as shown
in the Figure 1.
Figure 1. Place the baseplate
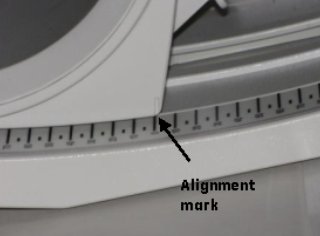
- Align the alignment mark on the coil to Zero position on the
Scale as shown in Figure 2.
Figure 2. Align the alignment mark
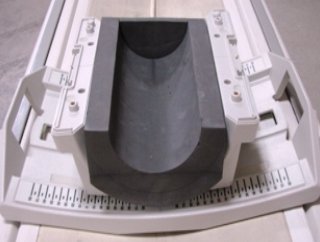
- Place the Phantom Positioner as shown in Figure 3.
Figure 3. Phantom Positioner
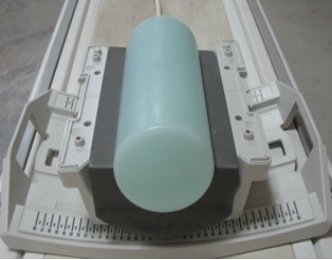
- Place the large cylindrical unified phantom in the phantom positioner
as shown in Figure 4.
Figure 4. Large cylindrical unified phantom
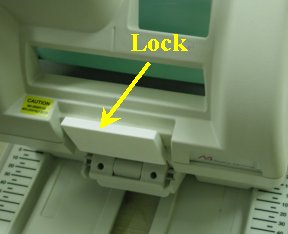
- Attach the anterior portion of the coil to the baseplate and
lock the coil as shown in Figure 5 and Figure 5.
Figure 5. Attach the anterior portion
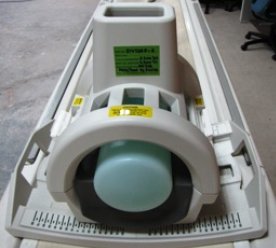
Figure 6. Lock
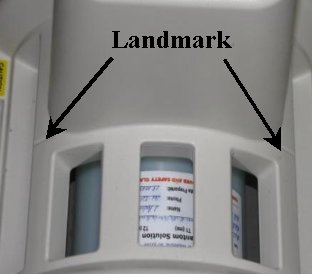
- Connect the Coil to respective port of the system LPCA and landmark
the coil on the marks shown in Figure 7. Then advance
to scan.
Figure 7. landmark
2 Coil Imaging Performance Verification
The GE HD T/R Quad Extremity Coil has one (1) coil name: HD T/R QUAD EXTREMITY, and can be used in the mode QUADKNEE . Refer to the Data Sheet in Step 1, to understand the data required to calculate the individual element SNR. The image quality check uses two different protocols for signal and noise image acquisition. The signal scan is an FSE sequence used to minimize susceptibility and B0 inhomogeneity effects. The noise scan is a GRE sequence that has a Control Variable (do_noise) to eliminate the transmit RF completely during the scan. The signal scan must be run prior to the noise scan as the R1, R2, and TG values from the signal scan are used for the noise scan.
2.1 Signal Scan
Procedure
- From the Scan Desktop, start new scan by selecting New Pt. Set Patient ID to geservice and Patient Weight to 111 pounds. Click Patient Position to open protocols window.
- At the console, set the protocols per the Signal section from Table 4, Signal and Noise Protocols.
- Click Save Series to download the protocols, then click Prepare to Scan.
- Run Auto Prescan. Take note of the R1, R2 and TG values.
- Run Scan.
2.2 Noise Scan
A signal scan must be run prior to the noise scan as the same R1, R2 and TG values must be used for both the signal and noise scans. Do not run an Auto Prescan prior to the noise scan as the values will be changed.
Procedure
- Copy the signal scan series. Use Copy Series (highlight signal series and click right mouse button) and Paste Series in RX Manager.
- Click View Edit and set the protocols per the Noise section from Table 4, Signal and Noise Protocols.
- Click Save Series and click Prepare to Scan.
- Open Display CVs menu under Research Operations. Set the rhformat and do_noise CVs to 1.
- Run Manual Prescan, and do not make any changes. Verify that R1, R2, TG and Bandwidth have not changed from the previously completed signal scan, and click Done.
- Run Scan.
3 SNR Measurement
Procedure
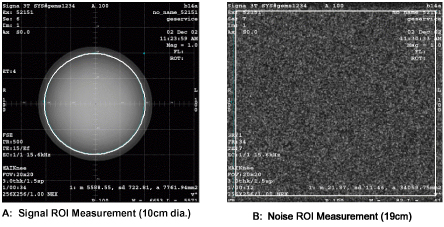
- A circular ROI should be used for the signal measurements, and a rectangular ROI should be used for the noise measurements. The actual ROIs should be similar in shape and size to those in Figure 9.
- ROIs in both signal and noise images can be measured directly in the image browser. Click the user interface button MEASURE, select the circular or rectangular shape, and adjust its size and orientation so that the ROI is similar to those found in Figure 8. Mean, standard deviation, and area of the ROI will appear in the lower right corner of the image.
- For the signal measurement, choose a 10 cm diameter circular ROI. This should be approximately a 5600 mm2. For the noise measurement, choose a 19 cm rectangular ROI. This should be approximately 34000 mm2. Record the values for mean signal, standard deviation of noise, and SNR in the data sheet found in Step 1.
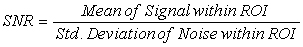
- Individual receiver SNR is defined as the mean of data within
the signal ROI divided by the standard deviation of data within the
noise ROI.
Figure 8. SNR Calculation
 note:
note:The SNR calculation uses the MEAN of the signal image and STANDARD DEVIATION of the noise image.
Figure 9. Example ROIs
The SNR measurements must be greater than or equal to the following specifications:
4 Finalization
Procedure
- Use the table provided below to record the calculated signal to noise ratio (SNR) data obtained from the Functional Checks section. 538814.pdf