Diagnostic Tests
Diagnostics are available to check most parts of the system. The following sections describe these tests. This information is also available from the hyper-linked test names on the MR system (see Section 1 of Running Diagnostics).
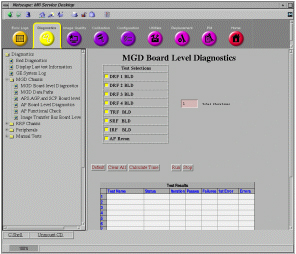
1 MGD BLD Tests
2 MGD Datapath Tests
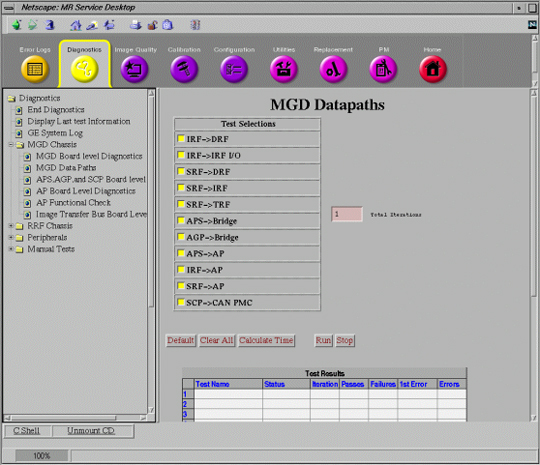
Refer to Figure 2. These diagnostics allow the testing of the communication paths between various boards in the MGD Chassis. Data paths diagnostics are tests, which transfer data from one FRU to another for the purpose of validating the hardware. This is accomplished where possible by utilizing the application code in a similar manner, as it would be used for patient scanning. This serves two purposes. The first is to detect the same errors as the application code does. The added advantage here is the canned data, which can be validated once it reaches its destination. The second advantage is the ability to validate the software as well as the hardware. The intensity at which the diagnostic works can speed up the detection of timing related problems. Test Results and Test Status are reported at the bottom of the window. Refer to Table 2 for test descriptions.
Figure 2. MGD DATAPATH TESTS
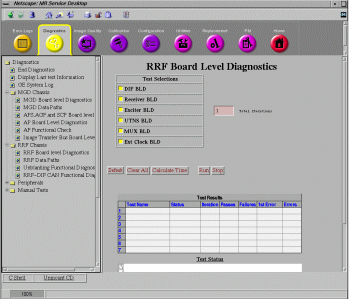
3 RRF BLD Tests
4 APS, AGP, and SCP Board Level Diagnostics
Refer to Figure 4. These diagnostics allow individual testing of the AGP, APS, and SCP Boards. Options can be selected from the right side of the window as described earlier. Refer to Table 4 for test descriptions.
Figure 4. MOTOROLA POWERPC BLD TESTS WINDOW
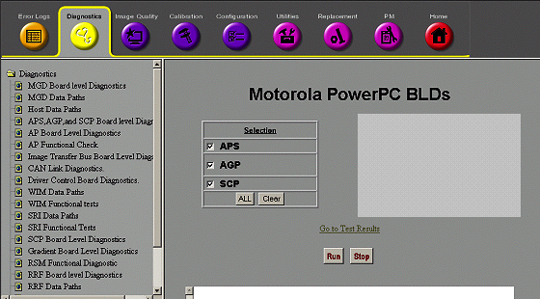
Once the selections are made, the test is started by selecting the RUN button in the middle of the window. The tests can be ended by selecting the STOP button located to the right of the RUN button.
-
When selected, the ALL button enables testing on all 3 boards.
-
When selected, the Clear button disables testing on all 3 boards.
5 CAN Link Diagnostic
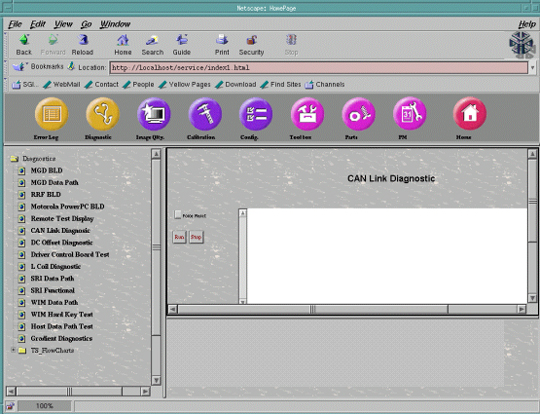
This diagnostic tests the functionality of the CAN Board daughter card that resides on the SCP Board in the MGD Chassis. This diagnostic first detects all the available nodes (in this case the Driver Control Module) on the CAN link by monitoring the Node Guarding messages. Once any nodes are detected, they are logged to the screen and then a data path test is run on each of them sequentially. The data path test consists of writing a walking one’s pattern on the Diagnostic Dictionary Index on the node and reading it back. The received data is checked to ensure its validity. The data path test is repeated three times on each node. Any errors will result in an error message logged and the information written to the screen. See Figure 5.
Figure 5. CAN LINK DIAGNOSTIC TEST
-
The Force Reset button will reset the CAN Link.
-
The Run button will start the execution of the diagnostic.
-
The Stop button will end execution of the diagnostic.
6 Driver Control Module BLD Tests
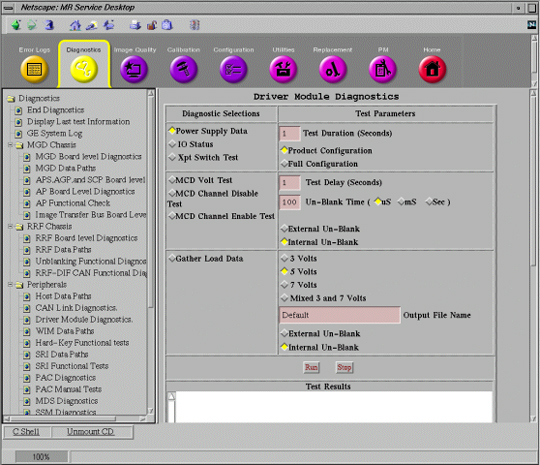
These diagnostics provide the ability to test the functionality of the Driver Control Module and components within this module. See Figure 6. Refer toTable 5 for test descriptions.
Figure 6. DCB DIAGNOSTIC WINDOW
6.1 DCB Power Supply Data
Figure 7 provides a display of what results should normally be seen, when running this diag in Product Configuration (the default selection). Note that all passing results are displayed in blue. Failing results are displayed in red. Product Configuration does not display the results from parts of the Driver Module that are not yet utilized. All results should be displayed in blue.
Figure 7. SAMPLE PRODUCT CONFIGURATION DCB POWER SUPPLY DATA OUTPUT SCREEN
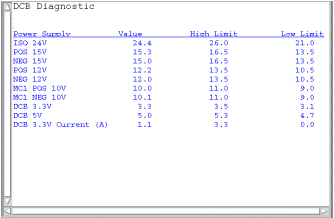
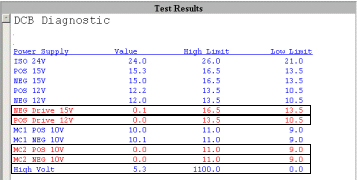
Figure 8 provides a display of what results should be seen when running this in Full Configuration. Full Configuration tests all parts of the Driver Module, including those parts not yet used. Notice the failing items displayed in red (NEG Drive 15V, POS Drive 12V, MC2 POS 10V, and MC2 NEG 10V). Also notice that while the High Volt parameter is colored blue, the Value number is very low. This is due to the fact that the limits are set very wide. Obviously, the High Volt parameter is for future use. Since none of the functions indicated by the failing red parameters are currently performed by the Driver Module, it is normal and expected to see these failures.
Figure 8. SAMPLE DCB POWER SUPPLY DATA OUTPUT SCREEN
6.2 DCB IO Status
Figure 9 provides an example display of what should be seen when running this diagnostic in Product Configuration. Again, normally all the results should be displayed in blue. Any failing results will be displayed in red. Don’t assume that failures reported here automatically mean that the Driver Module should be replaced. Try removing output cables to the Driver Module and run the diagnostic again. See if the results have changed. If they have, the problem may be external to the Driver Module.
Figure 9. SAMPLE DCB IO STATUS OUTPUT SCREEN IN PRODUCT CONFIGURATION
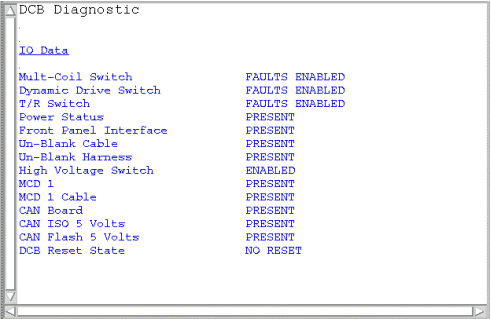
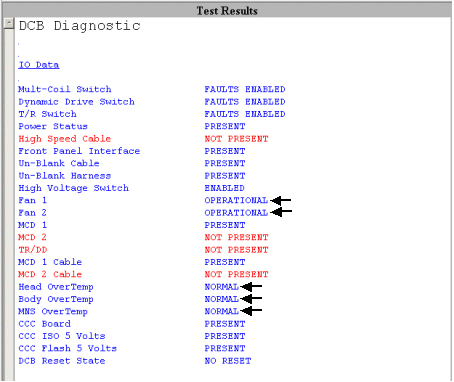
Figure 9 provides an example display of what should be seen when running this diagnostic in Full Configuration. Notice the failing items displayed in red (High Speed Cable, MCD 2, TR/DD, and MCD 2 Cable). Again, these failures are normal in Full Configuration since these functions are for future use. Note the items in the Test Results window marked with an arrow. These items are detected on the Driver Module TR/DD Board. Since Driver Modules in systems with an SSM do not have a TR/DD Board (the SSM performs these functions), the status of these parameters is not valid. A failure of Fan 1 or Fan 2 on the front of a Driver Module without a TR/DD Board will not result in a change in the Fan 1 or Fan 2 parameter. The operation of these fans should be confirmed by visual inspection. The Head, Body, and MNS Overtemp parameters are determined from the temperature of the driver transistors on the Driver Module TR/DD Board. Again, if the system has an SSM, then the Driver Module will not have a TR/DD Board and these values are therefore not valid. Finally, be aware that if the CAN Communication Core (CCC) Board fails then a message indicating that the CAN Link has failed will be displayed in the Test Results window instead of the IO Data.
Figure 10. SAMPLE DCB IO STATUS OUTPUT SCREEN
See a description of the remaining tests in Table 5.
7 SRI Datapath Tests
8 WIM Data Path Test
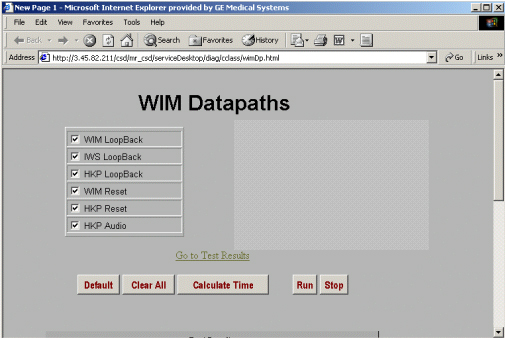
9 MGD Host Data Path Tests
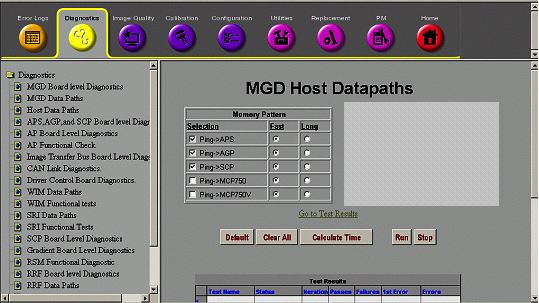
Refer to Figure 13. These tests permit the Host to repeatedly “ping” the selected component(s) within the MGD with patterns of data via the individual 100 BaseT Ethernet link(s). Be aware that if the Ping -> APS test is passing then it is normal for the Ping -> 750 test to fail. Likewise, if the Ping -> AGP test is passing then it is normal for the Ping -> 750V test to fail. The Ping -> 750 and Ping -> 750V tests should only be run if the APS and AGP tests fail. Refer to Table 8 for test descriptions.
Figure 13. MGD HOST DATA PATH TEST WINDOW
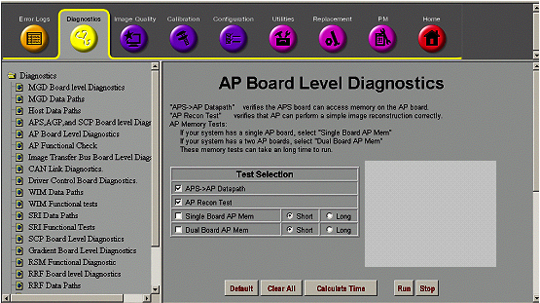
10 AP Board Level Diagnostics
These tests check the functionality of the AP Board(s). The AP Recon test reconstructs “canned” data from a file on the system. The data is not image data and so no image will be displayed after the reconstruction completes. See Figure 14. Notice that the tests are explained in the top of the screen. Refer to Table 9 for test descriptions.
Figure 14. AP BOARD LEVEL DIAGNOSTICS
11 SSM Board Level Diagnostics
These diagnostics check various functions and registers on the CPD Board inside the SSM. These tests do not check hardware external to the SSM. Be aware that all multicoil functions are now controlled by the Driver Module. The system still writes to the SSM Multicoil Register and so this diagnostic is still provided. See Figure 15 below.
Figure 15. SYSTEM SUPPORT MODULE DIAGNOSTICS
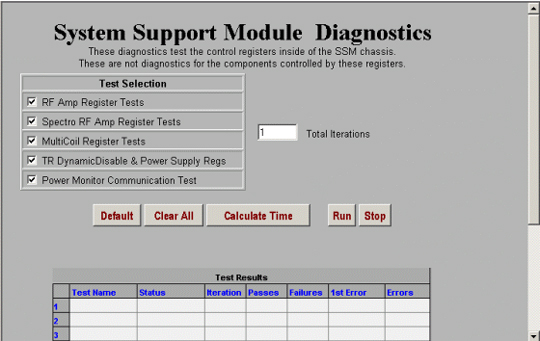
See Table 10 for an overview of each of the tests.
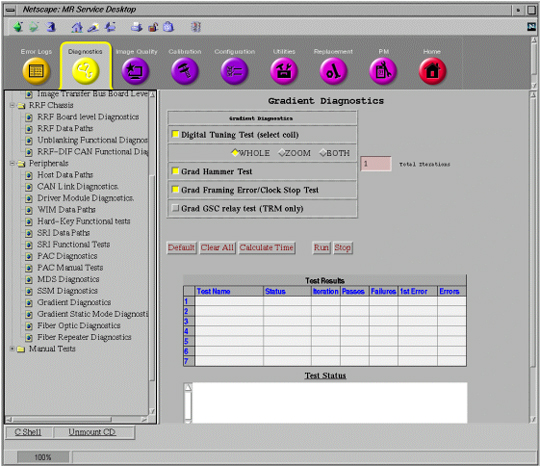
12 Gradient Diagnostics
The functionality of the Gradient hardware is directly exercised through running these diagnostics. Select Whole, Zoom, or Both for TwinSpeed Systems only. See Figure 16 below.
Figure 16. GRADIENT DIAGNOSTICS SCREEN
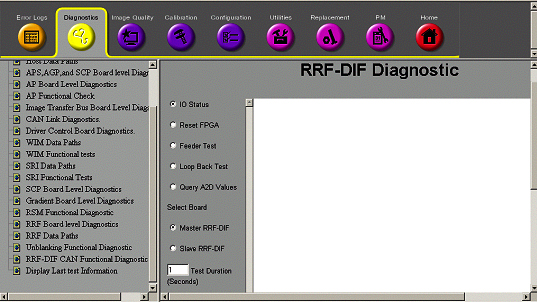
13 RRF-DIF Diagnostic
These tests, run from the SCP, verify features of the RRF through the CAN-Link. See Figure 17 below.
Figure 17. RRF – DIF DIAGNOSTIC SCREEN
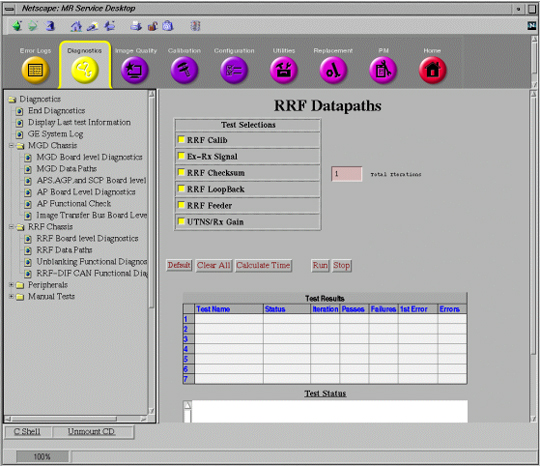
14 RRF Datapath Diagnostics
These diagnostics will check the functionality and communication paths of the listed RRF components. See Figure 18 below.
Figure 18. RRF DATAPATHS DIAGNOSTIC SCREEN
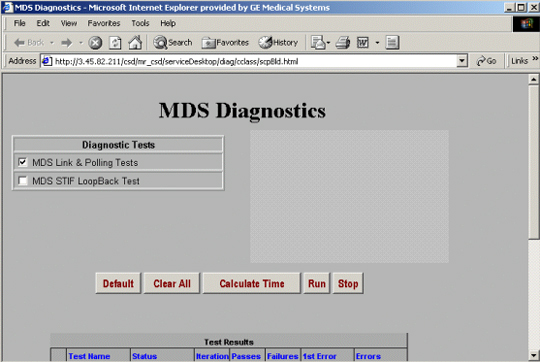
15 MDS Diagnostics
This test provides a means for check the functionality of the Multi-Drop Serial (MDS) Link. See Figure 19 below. The MDS Link is currently the primary means of communication between the System Cabinet and the other cabinets in the MR system.
Figure 19. MDS DIAGNOSTICS SCREEN
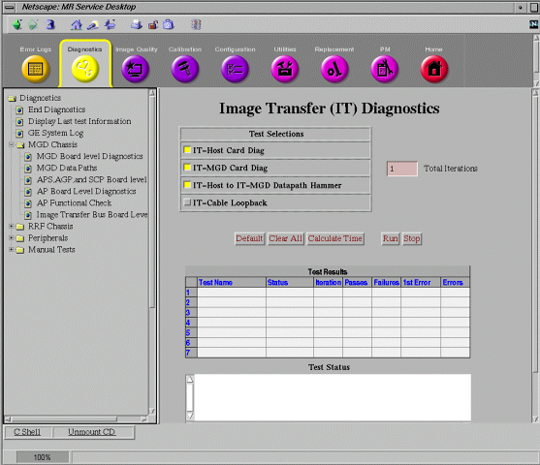
16 Image Transfer Bus Board Level Diagnostic
These diagnostics check the integrity of the Image Transfer fiber optic link. The diagnostics are explained as in the screen below in Figure 20.
Figure 20. IT BUS BOARD LEVEL DIAGNOSTIC SCREEN