System Health Check
System Health tool, sys_health, checks the existence, validity, and consistency of selected fields in system configuration and calibration files. Check status, along with field values, are displayed on the screen and in an output file named system_health.log in the /usr/g/service/log directory. The tool is used to identify possible configuration file corruptions, incorrect parameter settings, bad or missing calibration procedures, and calibration failures. Since it serves to identify and isolate possible problems and eliminate redundancy in the calibration process, the sys_health tool helps shorten the length of a troubleshooting session and provides the operator with a quick summary of the system health.
1 Running the Tool From the Service Browser
The service key should be inserted before running the system health check and reading the system health report.
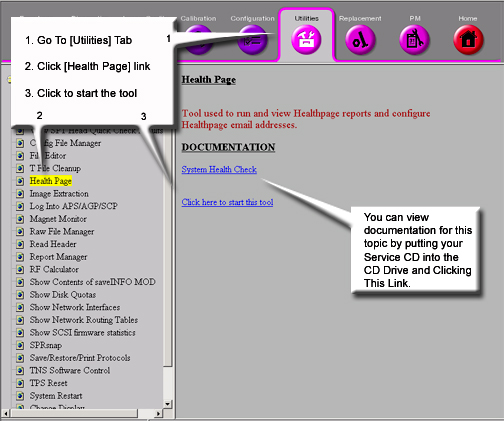
Figure 1. Starting the Health Page
-
To start System Health Tool, at the host computer, go to the Service Desktop. Start the Service Browser, if it is not already running, by clicking the Service Browser button on the left side of the screen. Refer to Figure 1.
Starting the tool will bring up the System Health tool. Refer to Figure 2 .
-
To run the a regular pass of system health, click on [Configure] and if it is available, select [Enable Health Page]. To run any variation of the other system health, make a selection based on the options in the [Configure] and [Report] windows (see step 4, Figure 2 and Table 1).
-
Click on [Report] and select [Full Report] (or for any other variation of System Health, (see step 4, Figure 2 and Table 1).
-
Menu items at the top of the window represent the controls available for this tool.
-
Exit closes the System Health Window.
-
Report opens a menu of three items:
-
Custom Report generates a report that is a subset of a full report. This subset is set up in the Configure pull-down menu.
-
Full Report gives a report of all items System Health is designed to look at.
-
Last Report displays the last System Health report generated. You can also view the last report run from the Service Browser. See Viewing System Health in the Service Browser.
-
Figure 2. System Health Tool
Reports will take several minutes to run.
Clicking Configure opens a menu of four items:
Figure 3. Auto Report Setup
Figure 4. Edit E-Mail Addresses
Figure 5. System Health Report Content
To toggle the “Include field between “Yes” and “No”, double click on the item.
2 Results File
The output (system_health.log) file can be displayed in a C-Shell by typing:
cd /usr/g/service/log and press Enter
|more system_health.log and press Enter
Press the Spacebar to view additional information until the end of the file is reached. Refer to sample System Health output.
3 Viewing System Health in the Service Browser
To view the last System Health that was run on the system, go to the Error Log tab of the Service Browser. See Figure 6.
Figure 6. Accessing the Health Page Log
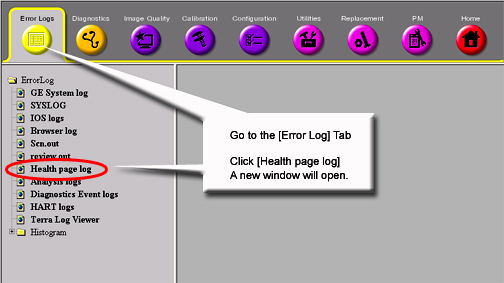
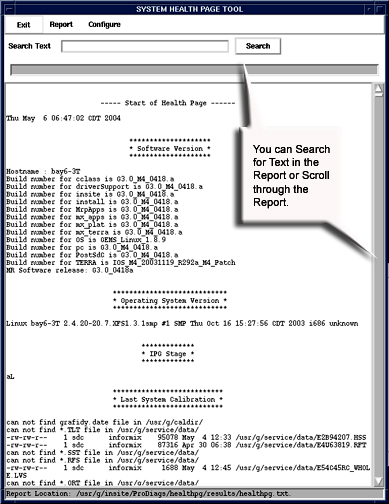
Figure 7. System Health Page
4 Miscellaneous System Data
4.1 Software Revision
The sys_health software determines the software revision on the current system by invoking the getver command.
4.2 MGD Emulation Mode
The sys_health software determines which system device is emulated by reading the mgd_stage file in the /usr/g/w/config directory. It extracts the line which starts with a. Each letter on that line indicates a device mode or status. See Table 2.
Entries are case sensitive.
When no components are emulated, then sys_health also reports this to the screen and the system_health.log file.
4.3 Disk Space Report
The sys_health tool reports the number of free disk blocks on the current system.
4.4 Install Options
The sys_health tool checks for installed options.
4.5 Host HW Inventory
The sys_health tool lists the hardware components on the host computer and reports all SCSI devices on the host that are powered up.
4.6 File Checksum
The sys_health tool checks file checksums. This feature is used to determine whether or not any software or patches have been loaded onto the system.
4.7 TNS Status
The sys_health tools reads the Transient Noise Suppresion (TNS) status, which reports the spike noise count data.
5 Advanced System Health Commands
For advanced usage, from a c-shell execute the following command to see available options with system health:
/usr/g/service/cclass/sys_health -h, then click Enter.
Some of the optional keys are defined in Table 1.
Only one option at a time can be selected (i.e., enter -p, -nf, or -h; do not include the “” characters or the command will not work). In most cases, the -nf option is used.