- Topic ID: reference_mtv_mpy_w3b
- Version: 3.0
- Date: Dec 29, 2020 1:02:26 AM
System Troubleshooting Tool
Overview
This document provides the necessary steps to launch the System Troubleshooting Tool. The System Troubleshooting Tool displays system data that can be used to troubleshoot the system while the system is energized.
1 Launching Tool
- Select Diagnostics from Service Desktop.
- Select System Troubleshooting Tool. Launch System Troubleshooting Tool window, as depicted in figure Figure 1, with following command:
/usr/g/bin/startSRVTool
Figure 1. System Troubleshooting Tool window
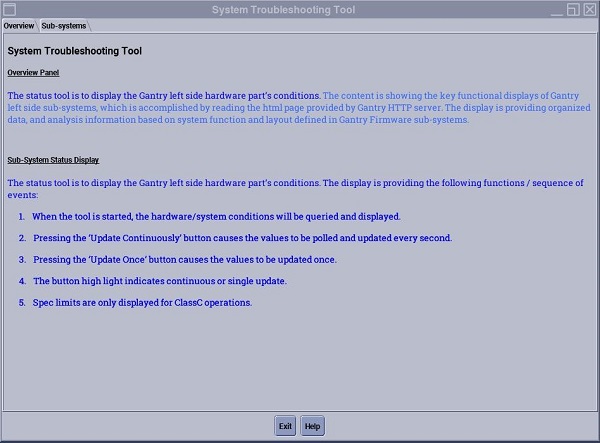 note: Overview Panel: Describes gantry left-side sub-system troubleshooting and service information.note: Sub-systems Panel: Displays data and status information.
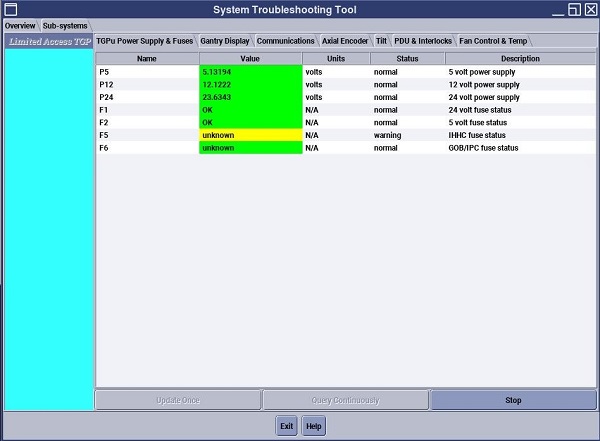
 - Select Sub-system tab. (See figure Figure 2) note: To display data using System Troubleshooting Tool, system must be operational, and some displays require system scanning to depict changes in data results.note: If gantry is powered off while System Troubleshooting Tool is active, a Reset message is displayed. Follow on-screen instructions to recover.
Figure 2. System Troubleshooting Tool
- Click Exit to close tool.
2 Tool Functionality
- When tool is launched, hardware/system conditions are queried in a continuous mode. Display is updated every second and is in Continuously Update mode.
- Click STOP releases Continuously Update mode.
- Click UPDATE ONCE causes values to be updated once.
- Display Color Definitions
- Green: Data in normal expected range.
- Yellow: Data exceed upper or lower warning limits.
- Red: Data exceed upper or lower specification limits.
note: Yellow and Red display colors only apply to power supplies. - Click HELP to be routed to systems service manual.
3 Finalization
No finalization steps.