- Topic ID: id_16157445
- Version: 2.0
- Date: Nov 7, 2019 8:53:45 PM
20cm QA Phantom Image Series Verification (without QA2 Protocol)
Prerequisites
1 Acquiring the 20cm QA Phantom Image Series
Procedure
- Mount the Phantom Holder on the head-end of the table.
- Mount the 20cm QA Phantom on the Phantom Holder.
- Align, level, and center the 20cm QA Phantom.
-
Align the etched line (QA#1 position) on phantom using the internal laser lights.
-
Level phantom using bubble level and the Z Axis knob on the Phantom Holder.
-
Center phantom using the CENTER PHANTOM procedure in the left head SCANNER UTILITIES selection and the X and Y Axis knobs on the Phantom Holder.
-
- Set up the system to scan the QA#1, QA#3 positions on the 20cm
QA Phantom.
MANUAL SCAN PROTOCOL SETUP
Refer to Table 2, Table 3 and setup an Axial scan with the parameters shown.
AUTO SCAN PROTOCOL SETUP
-
On the Exam Rx desktop, select NEW PATIENT.
-
Type the following entries in the listed Patient Information following fields:
-
Patient ID: Service
-
Name: 20cm QA Phantom Image Series
-
-
From the Protocol Selection display, click on the Service Tab under Anatomical Selector.
-
On the Service Protocol Selection window, click on MANUFACTURING.
-
On the Service Category Protocol List, for 4/8 slice system click on the 45.12 IMAGE SERIES QA selection; for 16 slice system click on the 45.9 IMAGE SERIES 20CM QA selection.
-
On the ExamRx protocol parameter display, select the 1st Series (Series Description: QA1 MTF 2x10/120kV/260mA/1s).
-
- Set internal Landmark.
- Acquire four 20cm QA Phantom image series as following:
-
(For BrightSpeed Select Series and Optima CT520 Series) :
-
Acquire the 1st 20cm QA Phantom image series and 2nd Recon series (MTF and Contrast, Visible Lines) by performing the 1st series protocol scan, the series name as “QA1 MTF 2x10/120kV/260mA/1s”. The 2nd Recon series is generated from QA1 MTF 2x10/120kV/260mA/1s automatically.
-
Acquire the 3rd 20cm QA Phantom image series by performing the 3rd series protocol scan, the series name as “QA3 LCD 2x10/120kV/140mA/1s”.
-
Acquire the 4th 20cm QA Phantom image series by performing the 4th series protocol scan, the series name as “QA3 LCD 2x10/120kV/200mA/2s”.
-
Acquire the 5th 20cm QA Phantom image series by performing the 5th series protocol scan, the series name as “QA3 Sm 2x10/120kV/260mA/1s”.
-
-
(For BrightSpeed Elite / Optima CT540) :
-
Acquire the 1st 20cm QA Phantom image series and 2nd Recon series (MTF and Contrast, Visible Lines) by performing the 1st series protocol scan, the series name as “QA1 MTF 2x10/120kV/260mA/1s”. The 2nd Recon series is generated from QA1 MTF 2x10/120kV/260mA/1s automatically.
-
Acquire the 3rd 20cm QA Phantom image series by performing the 4th series protocol scan, the series name as “QA3 LCD 2x10/120kV/140mA/1s”.
-
Acquire the 4th 20cm QA Phantom image series by performing the 5th series protocol scan, the series name as “QA3 LCD 2x10/120kV/195mA/2s”.
-
Acquire the 5th 20cm QA Phantom image series by performing the 6th series protocol scan, the series name as “QA3 Sm 2x10/120kV/260mA/1s”.
-
-
(For BrightSpeed Select Series and Optima CT520 Series) :
2 High Contrast Spatial Resolution
Procedure
- Specifications:
Each image of the series must pass 20cm QA#1 High Contrast Spatial Resolution parameter (Contrast Scale, Four-Image MTF Average and Visible Line Pair (for the first and second series scan parameters) specifications:
- Recommended Failure Recovery:
- Check Phantom Alignment (leveling is critical) and repeat this scanning and High Contrast Spatial Resolution Performance Test.
- Perform Alignment Procedures (POR Alignment, BOW Alignment, CBF/SAG Alignment, ISO Alignment, and Hot ISO Alignment), perform Full Calibration (Detailed Calibration and Auto CT# Adjust, and repeat this scanning and High Contrast Spatial Resolution Performance Test.
Figure 1. 20cm QA#1 Phantom High Contrast Spatial Resolution (Visible Line Verification)
3 Low Contrast Detectability
3.1 Image Performance Verification
Procedure
- Using the Auto 1x Tool on the Image Analysis screen, generate
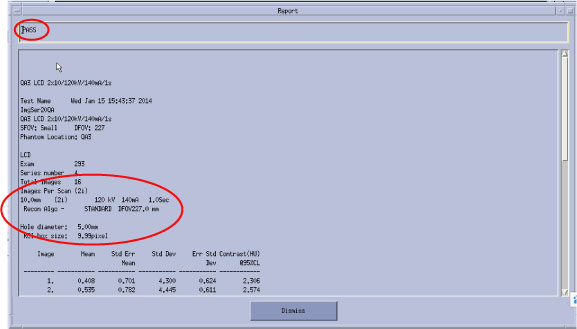
a Per Image QA#3 LCD report for the 3rd series of the 20cm QA Phantom acquisition.
-
From the Service Browser window, select the 1st image of the 3rd series of the 20cm QA phantom series acquired in the previous section.
-
Click on the Auto 1x rectangular button, select ImgSer 20QA from the pull-down menu, and slide cursor to the right to select the appropriate protocol for each systems. Detail refer to Table 4
-
Click on the Accept button, the report pops up.
Figure 2. QA3 LCD_140mA_1s (example only)
-
- Using the Auto 1x Tool on the Image Analysis screen, generate
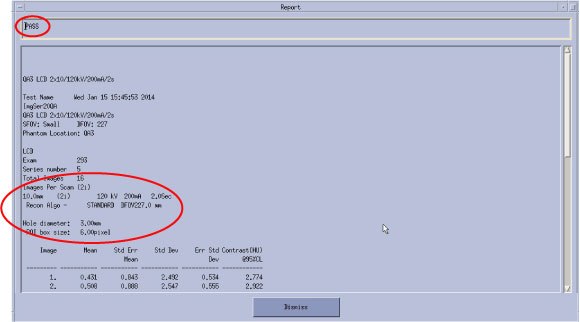
a Per Image QA#3 LCD report for the 4th series of the 20cm QA Phantom acquisition.
-
From the Service Browser window, select the 1st image of the 4th series of the 20cm QA phantom series acquired in the previous section.
-
Click on the Auto 1x rectangular button, select ImgSer 20QA from the pull-down menu, and slide cursor to the right to select the appropriate protocol for each systems. Detail refer to Table 4
-
Click on the Accept button, the report pops up.
Figure 3. QA3 LCD_200mA_2s (example only)
-
3.2 Failure Recovery
Procedure
- Specifications:
- Recommended Recovery:
- Verify all protocol values are correct and the phantom is centered.
- Rescan and then repeat the test to verify Image Performance.
- Perform Detailed Calibrations if necessary.
4 QA#3 Phantom Brightness Uniformity and CT#
4.1 Performance Verification
Procedure
- Select the fourth 20cm QA#3 Phantom exam acquired in the previous
section.
- From the Global Control Palette, click on the IMAGE WORKS Desktop.
- From the Image Works Desktop, select the IMAGE WORKS BROWSER window.
- Select the exam and fourth (QA#3) series acquired in the previous section.
- Select the VIEWER button on the Image Works Browser window. Set up the viewer window for four-image viewing.
- Build a 31 x 31 pixel reference ROI Box using the Image Works
Viewer tools.
- Click on the grid button to place a grid on the first image.
- Click on the MEASURE button and select the box ROI icon.
- Adjust the size of the ROI box to be a square 15 mm x 15 mm
(225 mm2) box. Tolerance: 15 mm ±
1 mm (196 mm2 to 256 mm2).
If required, magnify the image to adjust to proper dimensions. See Figure 4 for additional ROI size and placement information.
- Collect Mean values for five reference ROI Box positions on
the eight 20cm QA#3 Phantom images.
If required, magnify the image to adjust to proper dimensions. See Figure 4 for additional ROI placement information.
-
Position the reference ROI Box built in step 2 directly over the center of the image using the grid cross-hairs as a guide.
-
Type prop a in the Image Works Accelerator Line followed by <Return> to propagate Box # 1 ROI (size and position) on the remaining images in the series.
-
Click on the MEASURE button and select the box ROI icon to display Box # 2. The system places an ROI box labeled # 2 at the center of the image with the exact same dimensions as Box # 1.
-
Reposition Box # 2 to the left center portion on the first image.
-
Type prop a in the Image Works Accelerator Line followed by <Return> to propagate Box # 2 ROI (size and position) on the remaining images.
-
Record the Mean values of the eight images in the series for each of the five box positions in Table 6.
Each image can only display text for the mean, standard deviation, and box area for three images at a time. To view the data for a particular box, select the box on the image and the system displays the data for the box number selected.
-
- Calculate the Brightness Uniformity and CT# values for each
image in the series, record values in Table 7, and compare to specifications.
- Calculate and record the average means values (AvXo) for the four outside Boxes (Boxes 2 through 5) for each of the images and record in Table 7.
- Calculate and record the average center box (Box 1) means values (AvXc) for each row (2A1A: Images 1, 3, 5, and 7; 1B2B: Images 2, 4, 6, 8) in Table 7.
- Calculate and record the average outside boxes (Box 2 through 5) means values (AvXo) for each row (2A1A: Images 1, 3, 5, and 7; 1B2B: Images 2, 4, 6, 8) in Table 7.
- Calculate the Brightness Uniformity (AvXo - AvXc) value for each row and record in Table 7.
- Verify Brightness Uniformity (AvXo - AvXc) value and the average CT# value (AvXc) for each row meets specifications listed in Table 7.
- Record the 20cm QA#3 Phantom Brightness Uniformity (AvXo - AvXc) value and average CT# value (AvXc) for each row in the HHS Record Tables.
Figure 4. 20cm QA#3 Phantom Brightness Uniformity & CT# Measurement - Building And Placing Reference ROI Boxes
4.2 Failure Recovery
Procedure
- Specifications:
Each Row (2A1A, 1B2B) of the series must pass 20cm QA#3 Phantom Brightness Uniformity and average CT# specifications:
- Recommended Recovery:
- Perform DETAILED CAL.
- Perform AUTO CT# ADJUST.
- Repeat this procedure to verify 20cm QA#3 Phantom Image Performance.
5 QA#3 Phantom Noise
5.1 Performance Verification
Procedure
- Select the fourth 20cm QA#3 Phantom exam acquired in the previous
section.
- From the Global Control Palette, click on the IMAGE WORKS Desktop.
- From the Image Works Desktop, select the IMAGE WORKS BROWSER window.
- Select the exam and fourth (QA#3) series acquired in the previous section.
- Select the VIEWER button on the Image Works Browser window. Set up the viewer window for four-image viewing.
- Build a 51 x 51 pixel reference ROI Box using the Image Works
Viewer tools.
- Click on the grid button to place a grid on the first image.
- Click on the MEASURE button and select the box ROI icon.
- Adjust the size of the ROI box to be a square 25 mm x 25 mm
(625 mm2) box. Tolerance: 25 mm ± 1 mm (576 mm2 to 676 mm2).
If required, magnify the image to adjust to proper dimensions. See Figure 5 for additional ROI size and placement information.
- Collect Standard Deviation values for the single reference ROI
Box position on the eight 20cm QA#3 Phantom images.
If required, magnify the image to adjust to proper dimensions. See Figure 5 for additional ROI placement information.
-
Position the reference ROI Box built in step 2 directly over the center of the image using the grid cross-hairs as a guide.
-
Type prop a in the Image Works Accelerator Line followed by <Return> to propagate Box # 1 ROI (size and position) on the remaining images in the series.
-
Record the Standard Deviation values of the eight images in the series for centered box position in Table 8.
-
- Calculate the average Noise values for each image in the series,
record values in Table 8, and compare to specifications.
- Calculate and record the average Noise values (AvSDc) for the inside Boxes for each of the two rows (2A1A and 1B2B) and record in Table 8.
- Verify Noise (AvSDc) values for each row meets specifications listed in Table 8.
- Record the 20cm QA#3 Phantom Noise (AvSDc) for each row in the HHS Record Tables.
Figure 5. 20cm QA#3 Noise Measurement - Building And Placing Reference ROI Box
5.2 Failure Recovery
Procedure
- Specifications:
Each Row (2A1A, 1B2B) of the series must pass 20cm QA#3 Phantom Noise specifications shown in Table 8.
- Recommended Recovery:
- Perform DETAILED CAL.
- Perform AUTO CT# ADJUST.
- Repeat this procedure to verify 20cm QA#3 Phantom Image Performance.