- Topic ID: id_16157647
- Version: 3.0
- Date: Nov 27, 2020 2:09:26 AM
System Troubleshooting Tool (06MW29.7 and Later)
1 System Status Display
The status tool is started from the Common Service Desktop (CSD) and displays the current system hardware conditions. To access this tool:
-
Navigate to the CSD.
-
Click on the Diagnostic tab.
-
Locate the System Troubleshooting Tool near the bottom of the menu list.
-
Click on the tool to launch it.
The directions given in this document are a general overview of how to use the System Troubleshooting Tool to display system data.
The System Troubleshooting Tool is designed to service and troubleshoot the system while the system is energized.
Energized Left Side service or troubleshooting is not permitted for this product. Under no circumstances should an engineer service the left side of this equipment while the system is energized.
1.1 Tool Overview
1.1.1 Overview Screen
The Overview screen is displayed when the System Troubleshooting Tool is launched. The overview screen consists of the following:
-
The overview panel: describes the gantry left-side sub-system troubleshooting and service information.
-
The sub-system Status Display: describes how the tool displays data and status information.
1.1.2 Sub-system Screen
The subsystem screen is displayed when the Sub-system tab is selected. (See Figure 1.)
To display data using the System Troubleshooting Tool, your system must be operational, and some displays require user inputs with the system scanning to see data change results.
Figure 1. System Troubleshooting Tool
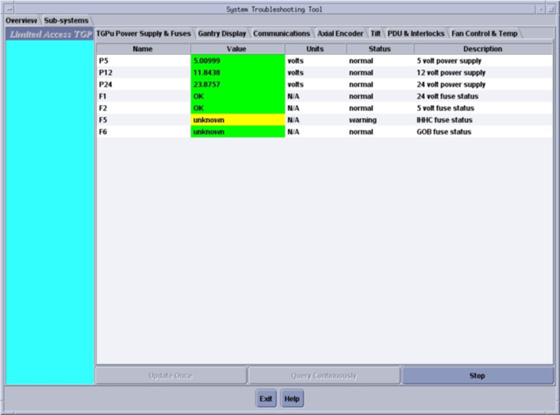
1.1.3 Displayed Data Format, Categories & Units
Name: describes the tasks or item being displayed.
Value: describes the data displayed.
Units: describes the units of measure.
Status: not used in this release.
Description: describes the tool or test being run.
The Green, Yellow and Red indicators are only active for power supply voltages.
Do not use color only as visual indicators of system operation.
1.2 Using the Tool
The System Troubleshooting Tool can be started from the CSD, or it can run remotely on a laptop when it is set up using the Laptop Setup Procedure and shipped Ethernet cable. To use your laptop, refer to Connecting Laptop to Console procedure.
The display provides the following functions/sequence of events:
-
When the tool is started, the hardware/system conditions is queried in a continuous mode. The display is updated every second and is in the Continuously Update mode.
-
Pressing the Stop button releases the Continuously Update mode.
-
Pressing the Update Once button causes the values to be updated once.
1.2.1 Display Colors (General)
The colors displayed are based on the following conditions:
The Yellow and Red display colors only apply to the power supplies.
Spec limits
-
Green: data in range
-
Yellow: data upper warning
-
Yellow: data low warning
-
Red: data below lower limit
-
Red: data above upper limit
2 System/Hardware Conditions Queried by the Tool
-
Table 1: TGPU Power Supply & Fuses (General)
-
Table 2: Gantry Display
-
Table 3: Communications
-
Table 4 : Axial Encoder
-
Table 5 : Tilt
-
Table 6: PDU & Interlocks
-
Table 7 : Fan Control & Temp
Screens shown in this document are representative of what is shown on the console or laptop screen and contains additional data that is not shown on the console or laptop screens.
Items on the screen may change location or order from system-to-system or software-to-software, but the intended use is the same.
Colors may not change or update for fuse status. Manual non-energized troubleshooting is required to check fuses, cables, and connections.
Table operation is required to see data change.
Manual non-energized troubleshooting is required to check fuses, cables, and connections. An exposure may be required to see changing results.
Manual non-energized troubleshooting is required to check fuses, cables, and connections. An exposure may be required to see changing results.
Operator interactions are required to see the data change.
Manual non-energized troubleshooting is required to check fuses, cables, and connections. An exposure may be required to see changing results.
3 Other Functions
3.1 Help
For help with the System Troubleshooting Tool, select Help from the bottom of the Sub-system tab. Help refers the user to the systems service manual.
3.2 Power Off
Turning off the gantry power using the service switch, or the sudden loss of power while using the System Troubleshooting Tool, results in a reset message displayed on the user screen. If this occurs, follow the on-screen instruction to recover.
3.3 Exit
To exit the System Troubleshooting Tool, select Exit from the bottom of the Sub-system tab.