- Topic ID: id_11038845
- Version: 3.0
- Date: Jun 10, 2020 2:24:57 AM
OpenOC16 with Z840 Host Computer Diagnostics
1 Overview
Console Diagnostics are a series of hardware specific scripts that utilize common commands automatically. This allows the user to test and or retest consistently without the need for manual keyboard entry. The commands used are basic.
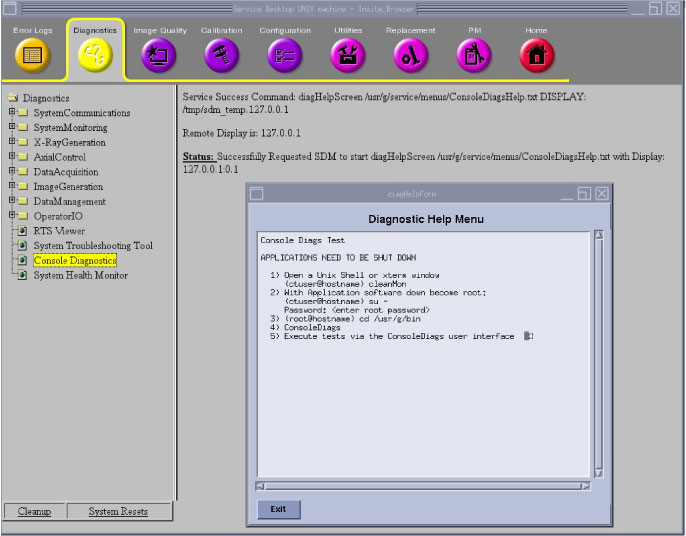
To access the Common Service Desktop, click on the Service icon, then Diagnostics, then Console Diagnostics. (See Figure 1.) Instructions are provided to shut down applications and perform manual entry in a Unix shell to invoke the diagnostic tool.
Figure 1. Console Diagnostics Screen
Class C must be loaded and the Service Key installed to perform Console Diagnostics.
2 Requirements
-
Application Software must be brought down with one of the following methods:
-
CSD (Common Service Desktop) via the Utilities / Application Shutdown selection
-
Unix Shell: {ctuser@hostname} cleanMon
-
-
The Operator Console should be rebooted before starting Auto-Console Diagnostics.
If a failure occurs during the testing and the Operator Console has not been rebooted prior to performing the diagnostic test selections, then reboot and retest the Auto-Console Diagnostics.
-
Media Failures: New (approved) media should be reserved for the PMT-22 Tower testing. Media should be formatted in advance and not write-protected.
3 Issues
-
Media Failures: during the media towers test the media content will be destroyed. There may be content / data on media that may cause the tests to fail. Whenever possible, new or specific media should be reserved for the media towers testing. Additionally, if the media towers tests fail, repeat the test and it may pass (and continue to pass). This may be a timing issue.
All system or customer media must be removed from the PMT before performing Auto-Console Diagnostics. This is done to avoid overwriting the DVD System State or any content. Media towers tests are always destructive to the content of the media installed in the media towers.
-
Try not to move the mouse around in the pop-up windows. Wait until the tests are completed to view the results.
-
Test including DIP will allow selection of the subsequent DIP Test script is performed with or without loopback capability. If loopback capability is selected (Yes, run the loopback test ) the DIP Board diagnostic will test the RX/TX ports.
-
If the test fails when loopback capability is selected, the site problem may be one of the following issues:
-
The Console's internal Fiber Optic Cable is faulty. Isolate the DIP from the internal fiber optic cabling and re-run the DIP loopback test.
-
The loopback cabling is not installed, it is bad, or it is not fully installed (clicked in).
-
The DIP board is faulty and must result in a replacement
-
4 Invoking Console Diagnostics
-
Install the Service Key.
-
If the user cannot perform the required reboot , then shutdown Application software to run diagnostics. Open a Unix Shell from the Toolchest and bring down Application software if necessary:
{ ctuser@hostname} cleanMon
note: Console Diags requires an Operator Console reboot for optimal performance. -
Close this Unix Shell.
-
With Application Software down, open a Unix Shell and type the following:
-
{ctuser@hostname} cd /usr/g/bin
-
{ctuser@hostname} ls *onsole*
console* ConsoleDiags@ consolediagsgui.py* HartConsoleCollect*
-
{ctuser@hostname} ConsoleDiags
-
-
A Pink Pop-Up Box appears. Click on the ENTER box to continue. The message below is displayed:
====================================================
Starting console diagnostics...
Console diags tool must be run as root.
Enter the root password when prompted.
====================================================
-
Input the required root Password:
Password: #bigguy
-
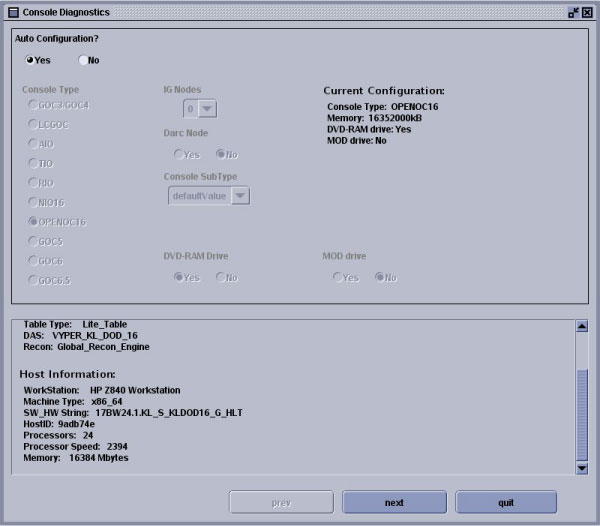
The Auto-Configuration Screen appears describing the Console Type and the number of IG Nodes presently configured.
-
Click on the Next button to move forward. The Previous button allows the user to return to a previous screen. The Cancel button cancels the Auto-Console diagnostic script and allows the script to perform the clean-up process. The Start Over button places the user at the Auto-Configuration Screen.
-
The screen displays information describing the system, Host and GPU present.
Figure 2. Invoking Console Diagnostics Screen
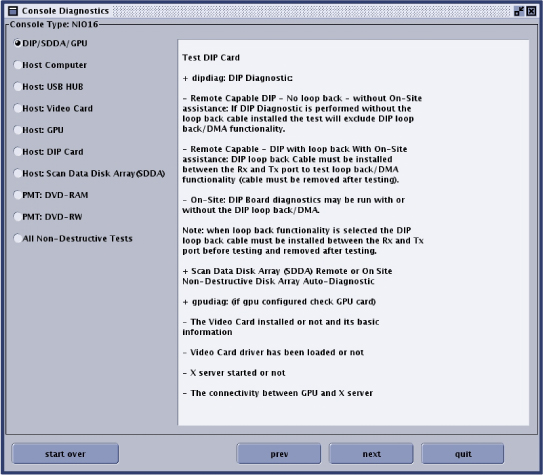
5 Menu Selections for Console Diagnostics
The Menu Screen provides the selection methodology for testing the various hardware residing within the Operator Console when performing Auto-Console Diagnostics.
Figure 3. Console Diagnostics Screen
-
DIP/SDDA/GPU (Recon Hardwares)
-
Host Computer
-
Host: USB HUB
-
Host: Video Card (K620)
-
Host: GPU (M5000)
-
Host: DIP Card
-
Host: Scan Data Disk Array (SDDA)
-
PMT: DVD-RAM (destructive to media content)
-
PMT: DVD-RW (destructive to media content)
-
All Non-Destructive Tests
6 Running Console Diagnostics
-
Click on a test menu selection.
-
Click on the Next button to move forward to the Repetitive Screen.
6.1 Repetitive Screen
-
The next screen (not shown) is repetitive information of the test selection.
-
Click on the Next button to move forward to the Contact Screen.
6.2 Contact Screen
-
The Contact Screen allows the user to inform other service personnel and Customers that the Operator Console is in use and provides important Contact Information.
-
If necessary, position the cursor in the Name entry block and click.
-
Enter your Name or the on-call contact.
-
Press the Tab keyboard selection.
-
Enter the Phone number you can be reached at or the on-call contact number.
-
Click on the Next button to move forward to the Iteration Screen (or the Loopback Screen for DIP Test ONLY).
6.3 Iteration Screen
-
The Iteration Screen allows the user to select the number of passes or iterations required to determine the present failure. Normally, a single (1) iteration is usually adequate to determine a failure, however, intermittent failures may require extensive iterations.
-
In the Iterations entry field block, input the number of iterations to be performed.
-
Click on the Next button to move forward to the Loopback or Start Screen
6.4 Loopback Screen
-
Whenever Test DIP is selected. This test script allows for a choice to test the DIP Board in a stand-alone manner or with a loopback capability. If loopback capability is selected the DIP Board diagnostic will test the RX/TX ports when the loopback cable is installed.
-
Click the button
-
Yes, run the loopback test
-
No, do not run the loopback test
-
-
Click on the Next button to move forward to the Start or Media Screen.
6.5 Media Screen
-
Whenever Test MOD or DVD is selected the media inserted/ warning screen will appear. This screen informs the user that the content /data of any media installed in the MOD Tower or PMT (Peripheral Media Tower for DVD) will be lost/destroyed. Additionally, the user is informed that the System State should or write-protected media should not be used. Some users may have issues with media containing DICOM.
-
Insert the media (MOD and DVD) into the PMT-22 Tower drives.
-
Wait one minute or until the media inserted has completed initializing.
-
Click the button: Yes, the media has been inserted.
-
Click on the Next button to move forward to the Start Screen.
6.6 Start Screen
The Start Screen allows the user the choice of starting the Auto-Console Diagnostic Tests at any time.
When the Start button is selected the user may no longer select the Previous button to adjust test selection set-up.
Click on the Start button to begin testing.
7 Test Log Files
The Auto-Console Diagnostic log files are overwritten with each time the script is run.
[ctuser@hostname] cd /usr/g/ConsoleDiags/log
[ctuser@hostname] more display.log
Ctrl+C to exit viewing log file.
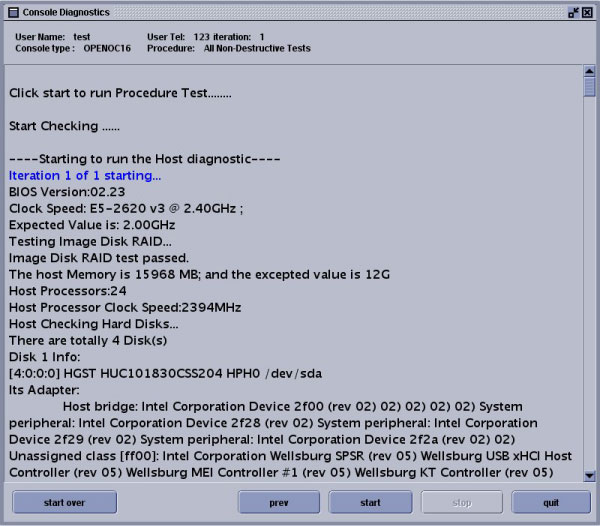
8 Example Output for Console Diagnostics
In this section, examples are provided to assist the user in determining potential output. To view a selection, click on a link below. Not every example of output can be provided (failing vs. passing).
9 Additional Information
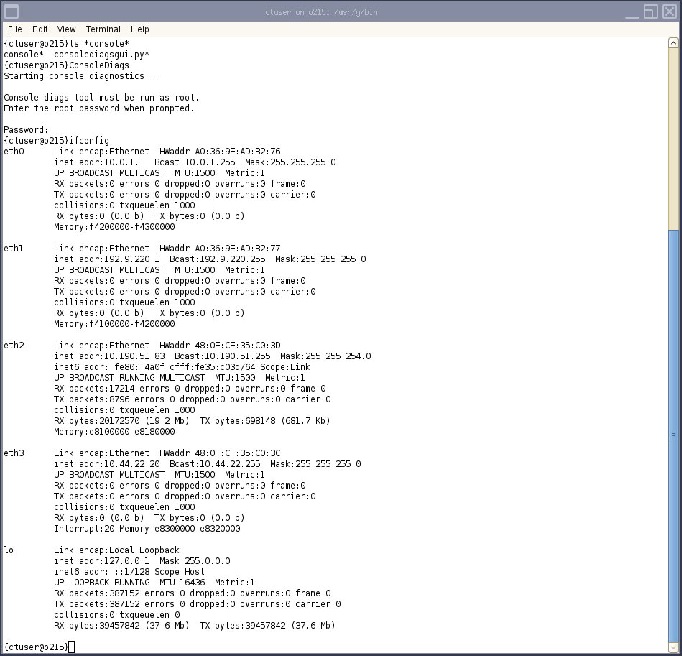
9.1 Host ifconfig command
The ifconfig command as run on the Z840 Host Computer from ctuser will verify if there is any type of active connection – but not necessarily the correct active connection. Active connections can be verified using the ping process. Look for running. Remember that running is a moment in time and does not mean the connection is still active for the next moment in time.
{ctuser@hostname} ifconfig
9.2 GPU Card Diagnostics
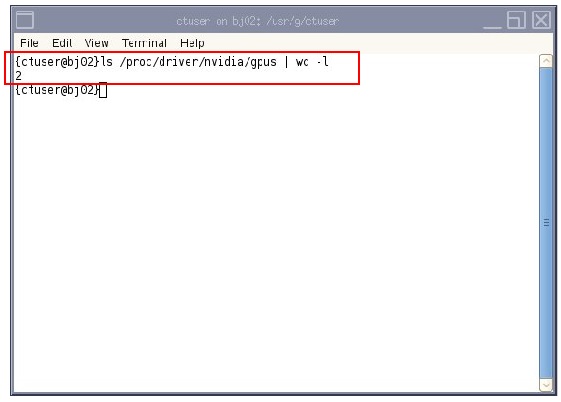
9.2.1 Check GPU Graphic Card Number
Check the GPU card installed.
{ctuser@hostname} ls /proc/driver/nvidia/gpus | wc —l
-
If "2" displays, both K620 and M5000 (GPU) cards are installed.
-
If “1” displays, only K620 (GPU) card is installed.
9.2.2 GPU Test Command
{root@hostname} gpudiag
If TEST SUCCEEDED. GPU functions well.
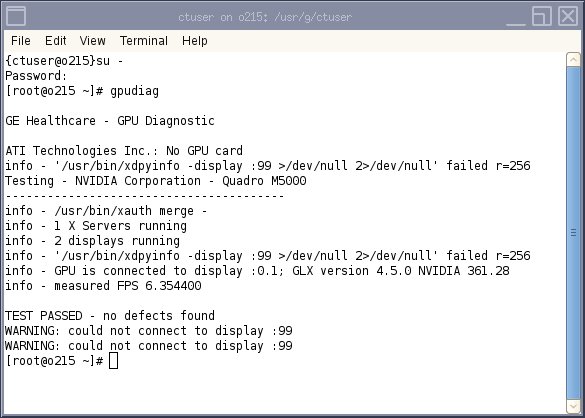
If TEST FAILED, refer to the display message and RECOMMENDED ACTION.
THIS MAY NOT BE A HARDWARE ISSUE.
Verify that the system software has been loaded correctly.
{ctuser@hostname} su -
Password:enter
{root@hostname} # gpudiag
Examples of test passed.
{root@bay ~} # gpudiag
GE Healthcare - GPU Diagnostic
ATI Technologies Inc.: No GPU card
Testing - NVIDIA Corporation - Quadro M5000
-----------------------------------------
info - /usr/bin/xauth merge -
info - 1 X Servers running
info - 2 displays running
info - GPU is connected to display :0.1; GLX version 4.5.0 NVIDIA 361.28
info - measured FPS 6.354400
TEST PASSED - no defects found
{root@bay ~} #
10 Output Examples
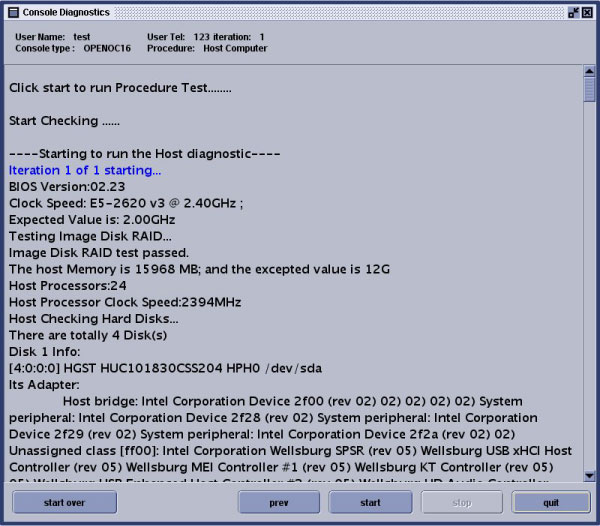
10.1 Host Test – Z840
Figure 4. Host Computer - Z840 Test
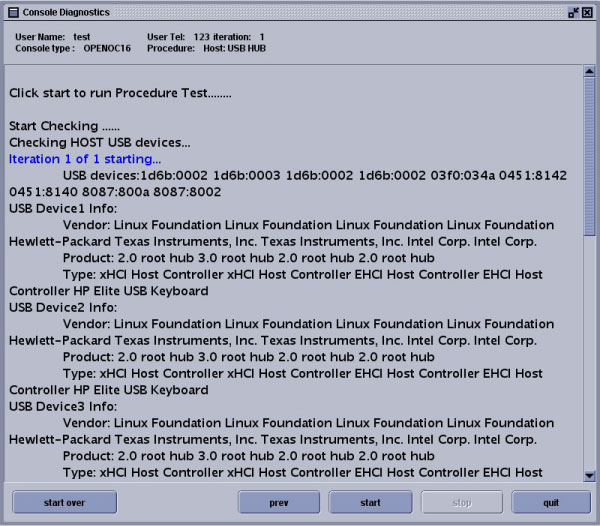
10.2 Host USB HUB Test
Figure 5. USB HUB Test
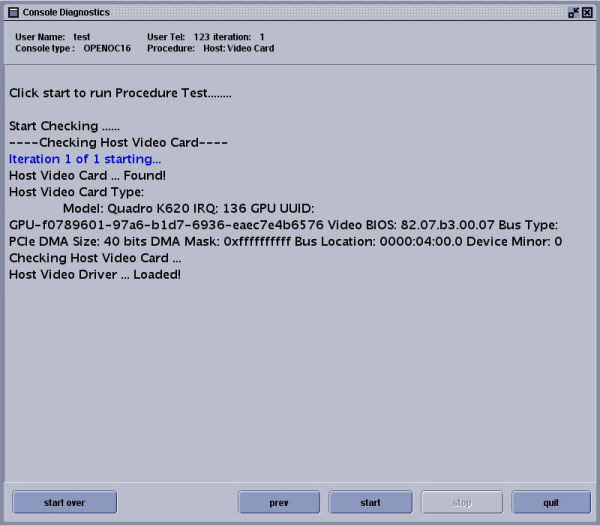
10.3 Video Card (K620) Test
Figure 6. Video Card Test
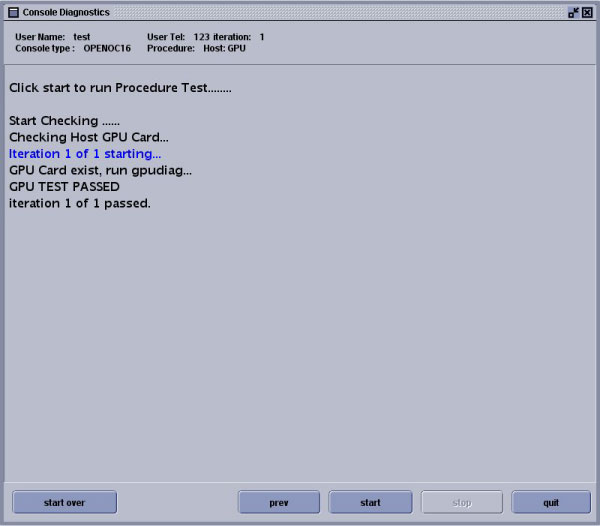
10.4 GPU Card (M5000) Test
Figure 7. GPU Diagnostic Test
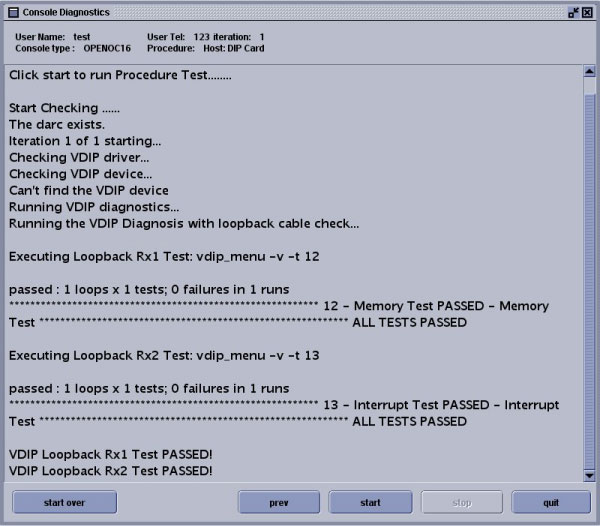
10.5 DIP Card Test with Loopback Cable Installed
Figure 8. DIP Card Test with Cable Installed
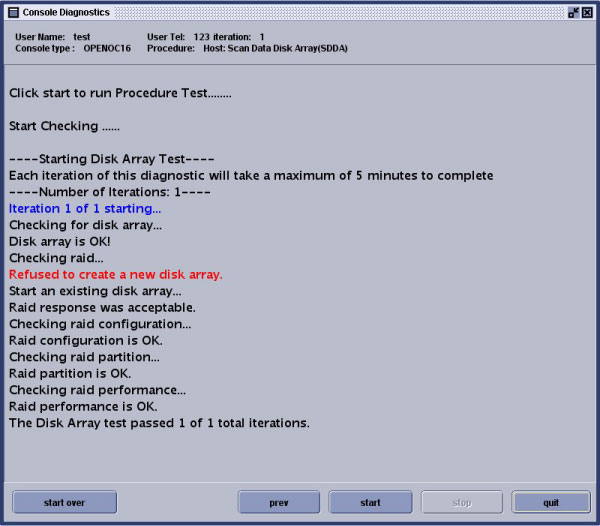
10.6 Scan Data Disk Array (SDDA)
Figure 9. SDDA Test
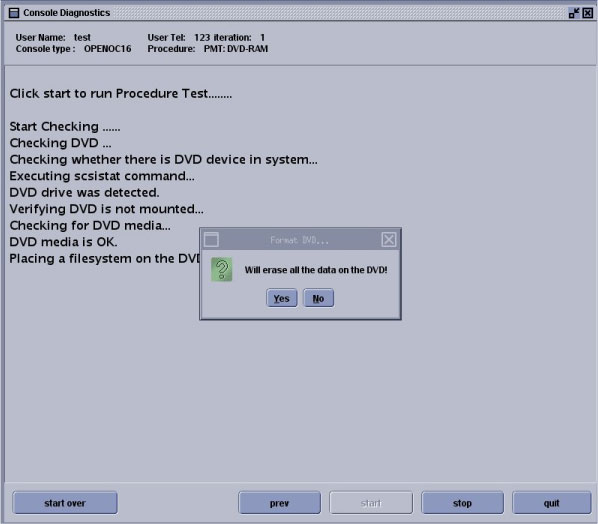
10.7 DVD-RAM Test
Figure 10. DVD-RAM Test
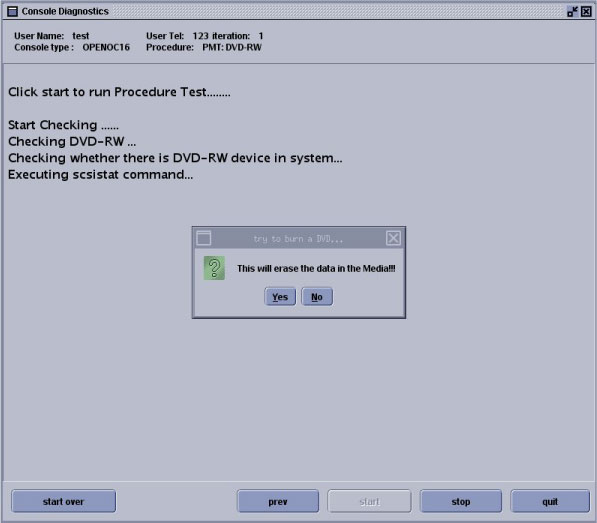
10.8 DVD-RW Test
Figure 11. DVD-RW Test
10.9 Non-Destructive Disk Array Test
Figure 12. Non-Destructive Disk Array Test